
Why Bond Fund Investors Missed Out
Explaining the gap between bond funds’ investor returns and total returns.


We recently published our annual “Mind the Gap” study. You can get a quick synopsis of the study’s key takeaways here, but one of the notable findings is that bond-fund investors once again captured a smaller share of their funds’ total returns than investors did in other types of funds. You can see that in the chart below, which is taken from the study.
Exhibit 3: Annual Investor Return Gaps by Category Group (10 Years Ended Dec. 31, 2024)
It’s even more apparent when we express the gap as a percentage of total return, which I’ve done in the chart below.
Annl. Investor Return Gap as Percentage of Total Return, by Cat. Group (10 Years Ended Dec. 31, 2024)
In summary, bond-fund investors captured around half of their funds’ total returns, whereas investors in other types of funds captured far more. Put another way, the gap between the return of the average dollar invested in bond funds and those funds’ aggregate total return was far larger than it was for other fund types.
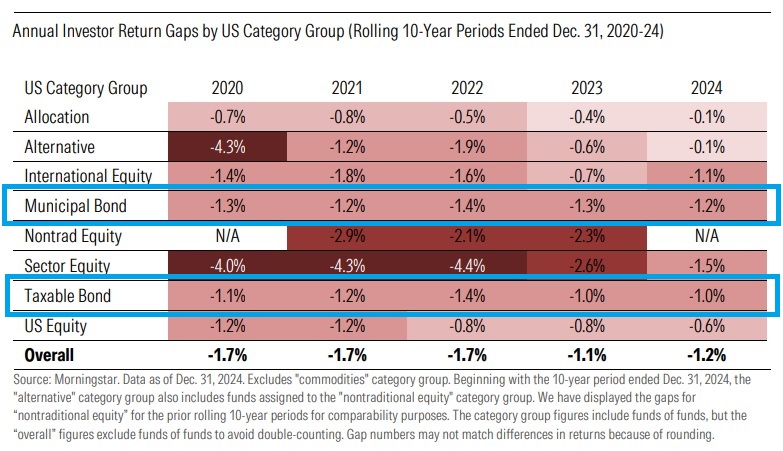
This isn’t a new thing, either. From this table (which is also taken from the study), you can see what the gaps were for various asset classes over the rolling 10-year periods ended Dec. 31 of the years 2020-24. What you’ll notice is that there was usually a 1 percentage point annual gap between bond-funds’ investor returns and total returns. That might not be the largest in absolute terms, but in percentage terms, it has been among the highest of the various category groups.
Annual Investor Return Gaps by Category Group
The question is why.
Flows and Returns
To break this down schematically, we should start with the trend in bond-fund flows. Here’s what that picture looked like for the bond funds we included in the study (that is, all those that existed as of Jan. 1, 2015).
Calendar Year Net Flows to Taxable Bond and Municipal Bond Funds Included in "Mind the Gap"
From 2015 through 2021, investors poured $1.4 trillion into taxable and municipal bond funds in total. When the bottom fell out in 2022, they yanked $450 billion, with many investors seeking refuge in money-market funds. Muni fund flows were largely flat in 2023 and 2024, but flows to taxable bond funds picked up anew, with investors adding an aggregate $230 billion in net new monies in those years.
Here’s how I think of that in investor-return terms: When there are inflows to a pool, it makes it “heavier,” as there are more assets in it, and correspondingly, outflows make it “lighter.” Seen in those terms, the bond-fund asset pool got heavier and heavier from 2015 through 2021, then sprang a leak in 2022.
If returns improve after a pool gets heavier (or worsen after it gets lighter), then investor returns can exceed total returns. But if the opposite is true, then investor returns will lag total returns, resulting in a gap. Given this, the other piece of the picture we need is the trend in bond-fund returns.
To keep things simple, I grabbed the calendar-year returns of the Bloomberg Aggregate Bond and Bloomberg Municipal Bond Indexes, which proxy for taxable bonds and municipals, respectively. Here’s what that looked like.
Calendar Year Return of Bloomberg Municipal and Bloomberg US Aggregate Bond Indexes
And here’s the year-over-year change in the indexes’ returns.
Year-over-Year Return Change: Bloomberg Municipal and US Aggregate Bond Indexes
In most cases, returns deteriorated from the previous year. Yet, as we saw, investors were generally adding money to bond funds over this span. Moreover, in the few periods, returns improved—2018 to 2019 and 2022 to 2023, for instance—investors had pulled money the previous year, meaning the pool had gotten lighter just before performance perked up. You can see that relationship more clearly in this scatterplot, in which I compare the flows each year to the change in returns between that year and the following year.
Comparing Bond Fund Net Flows and Year-over-Year Return Change
(There are 18 dots, as there were nine comparisons apiece for taxable bond funds and municipal bond funds.)
Ideally, bond-fund investors would have added moneys before returns improved (the plot’s top-right quadrant) or withdrawn before performance suffered (bottom-left). But more often than not, they added before returns eroded (the nine dots shown in the bottom-right) or redeemed before performance snapped back (the four dots in the top-left), explaining the return gap.
Investors Still Need to Mind the Gap in Their Funds’ Returns
Demographics and Cash
I’ve given the X’s and O’s of why a gap seems to have formed between bond-funds’ investor returns and total returns over the decade ended Dec. 31, 2024. But it doesn’t necessarily tell us why investors decided to buy or sell bond funds as they did.
Bond-fund performance was hardly stellar in this decade, with taxable and municipal bond funds earning only around 2% per year in aggregate total returns. That included a historically bad year (2022) that scattered some bond-fund investors who’d never experienced such large losses in their core bond-fund positions. But in most of the other years, they were adding moneys amid low-to-mid single-digit returns. Not exactly the stuff of euphoria and despair.
To be sure, investors did increasingly shift to passive bond funds and bond exchange-traded funds, both of which saw larger gaps as a percentage of their total returns than active bond funds or open-end fixed-income funds did.
Annual Investor Return Gaps by US Category Group and Type
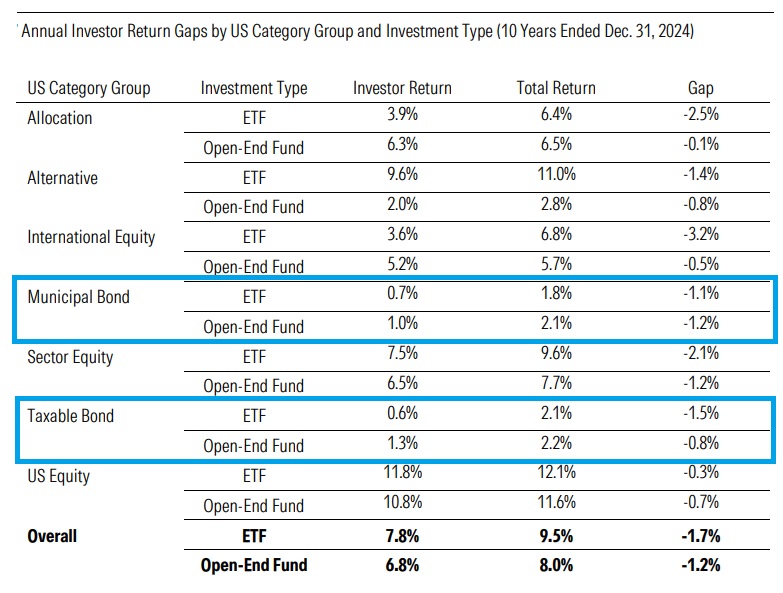
But that shift alone doesn’t fully explain why bond-fund investors would have failed to capture around half their funds’ total returns, as active open-end bond funds still accounted for most of the assets during this period.
Instead, what it likely boils down to is some combination of demographics and cash substitution. As the population ages, it brings investors closer to their postretirement years. With a shorter time horizon and less margin for error, they increasingly favor the stability and predictability of fixed income. This likely explains the overarching pattern of inflows to bond funds over this period, despite their pedestrian returns and low yields.
Before the Federal Reserve began its hiking cycle, cash substitutes like money-market funds weren’t a strong candidate to replace bond funds, as they paid virtually nothing, whereas bond funds at least yielded a few percent or so. But as the Fed tightened and money-market yields jumped higher, it created a much stronger incentive to trade out of bond funds, which bond-fund investors did en masse in 2022.
Takeaways
While it might seem tempting to chalk the gap up to investors acting rashly, it’s probably more nuanced than that. As mentioned, bond-fund investors’ aggregate purchases and sales could be driven by circumstantial factors, like their age, or reflect their urge to derisk in ways that might be laudable, such as substituting competitively yielding cash for longer-duration bonds.
Certainly, there are episodes that suggest bond-fund investors are given to impulses like fear, like when they’ve fled bond funds following poor returns, only for performance to subsequently improve. That underscores the importance of preparing for the risk of lackluster returns, perhaps by shortening duration (that is, interest rate sensitivity), which in turn could lessen volatility and with it the urge to bail amid turbulence.
The other potential takeaway for bond-fund investors is temper expectations. To be sure, a high-quality bond’s starting yield-to-maturity has tended to approximate its future return over the bond’s term. And so, there’s a natural tendency for us as bond investors to assume we’ll earn a return approaching the fund’s starting yield. But as the findings suggest, bond-fund investors tended not to capture their funds’ total returns, making it prudent to haircut our estimate of what we might earn from our fixed-income holdings over a future horizon. That might be unpalatable, but it’s at least clear-eyed and should promote better planning.
Switched On
Here are other things I’m writing, reading, listening to, or watching:
- Bryan Armour with a roundup of Morningstar’s first batch of “semiliquid” fund ratings
- Robin Wigglesworth on the mystery surrounding massive recent inflows to, and outflows from, ARK Innovation ETF
- Vanguard’s Global Chief Economist Joe Davis talks megatrends on The Long View podcast
- Seamus Murphy on taking photographs in Syria and Afghanistan and how he came to work with PJ Harvey
- Single-stock ETFs, option-income ETFs, conversions: A breakdown of recent ETF launches
- What part of the cycle are we at? The part where people unironically file for “Income Blast” ETFs.
- Ween “Transdermal Celebration”; Pinback “Summer in Abaddon”
Don’t Be a Stranger
I love hearing from you. Have some feedback? An angle for an article? Email me at jeffrey.ptak@morningstar.com. If you’re so inclined, you can also follow me on Twitter/X at @syouth1, and I do some odds-and-ends writing on a Substack called Basis Pointing.
The author or authors do not own shares in any securities mentioned in this article. Find out about Morningstar’s editorial policies.

 United States