
Should Fidelity Investors Just Index?
Assessing the quality of the company’s actively managed funds.


Fidelity’s Turn
This past August, I compared the risk-adjusted returns of Vanguard’s leading passive funds against those of the company’s biggest actively managed funds. The active funds were clearly better. In truth, it was not much of a contest.
Today I repeat that exercise, this time for Fidelity’s funds. The test subjects are Fidelity’s most popular funds from five years ago: the company’s 10 largest passive and active offerings as of February 2018. Then I located each fund’s five-year risk-adjusted return, as ranked against funds sharing the same investment category. (In theory, this study included exchange-traded funds as well as mutual funds, but as Fidelity’s ETF business was nascent until recently, that point is moot.)
The Passive Scores
For example, Fidelity 500 Index FXAIX was the firm’s biggest passive fund in early 2018. Since then, the fund has bested 77% of its large-blend fund rivals, earning it a risk-adjusted Morningstar Category ranking of 23, as Morningstar’s system assigns a score of 1 to the best outcome and 100 to the worst. The following chart shows the rankings of the 10 passive funds. The shorter the bars, the better the results.
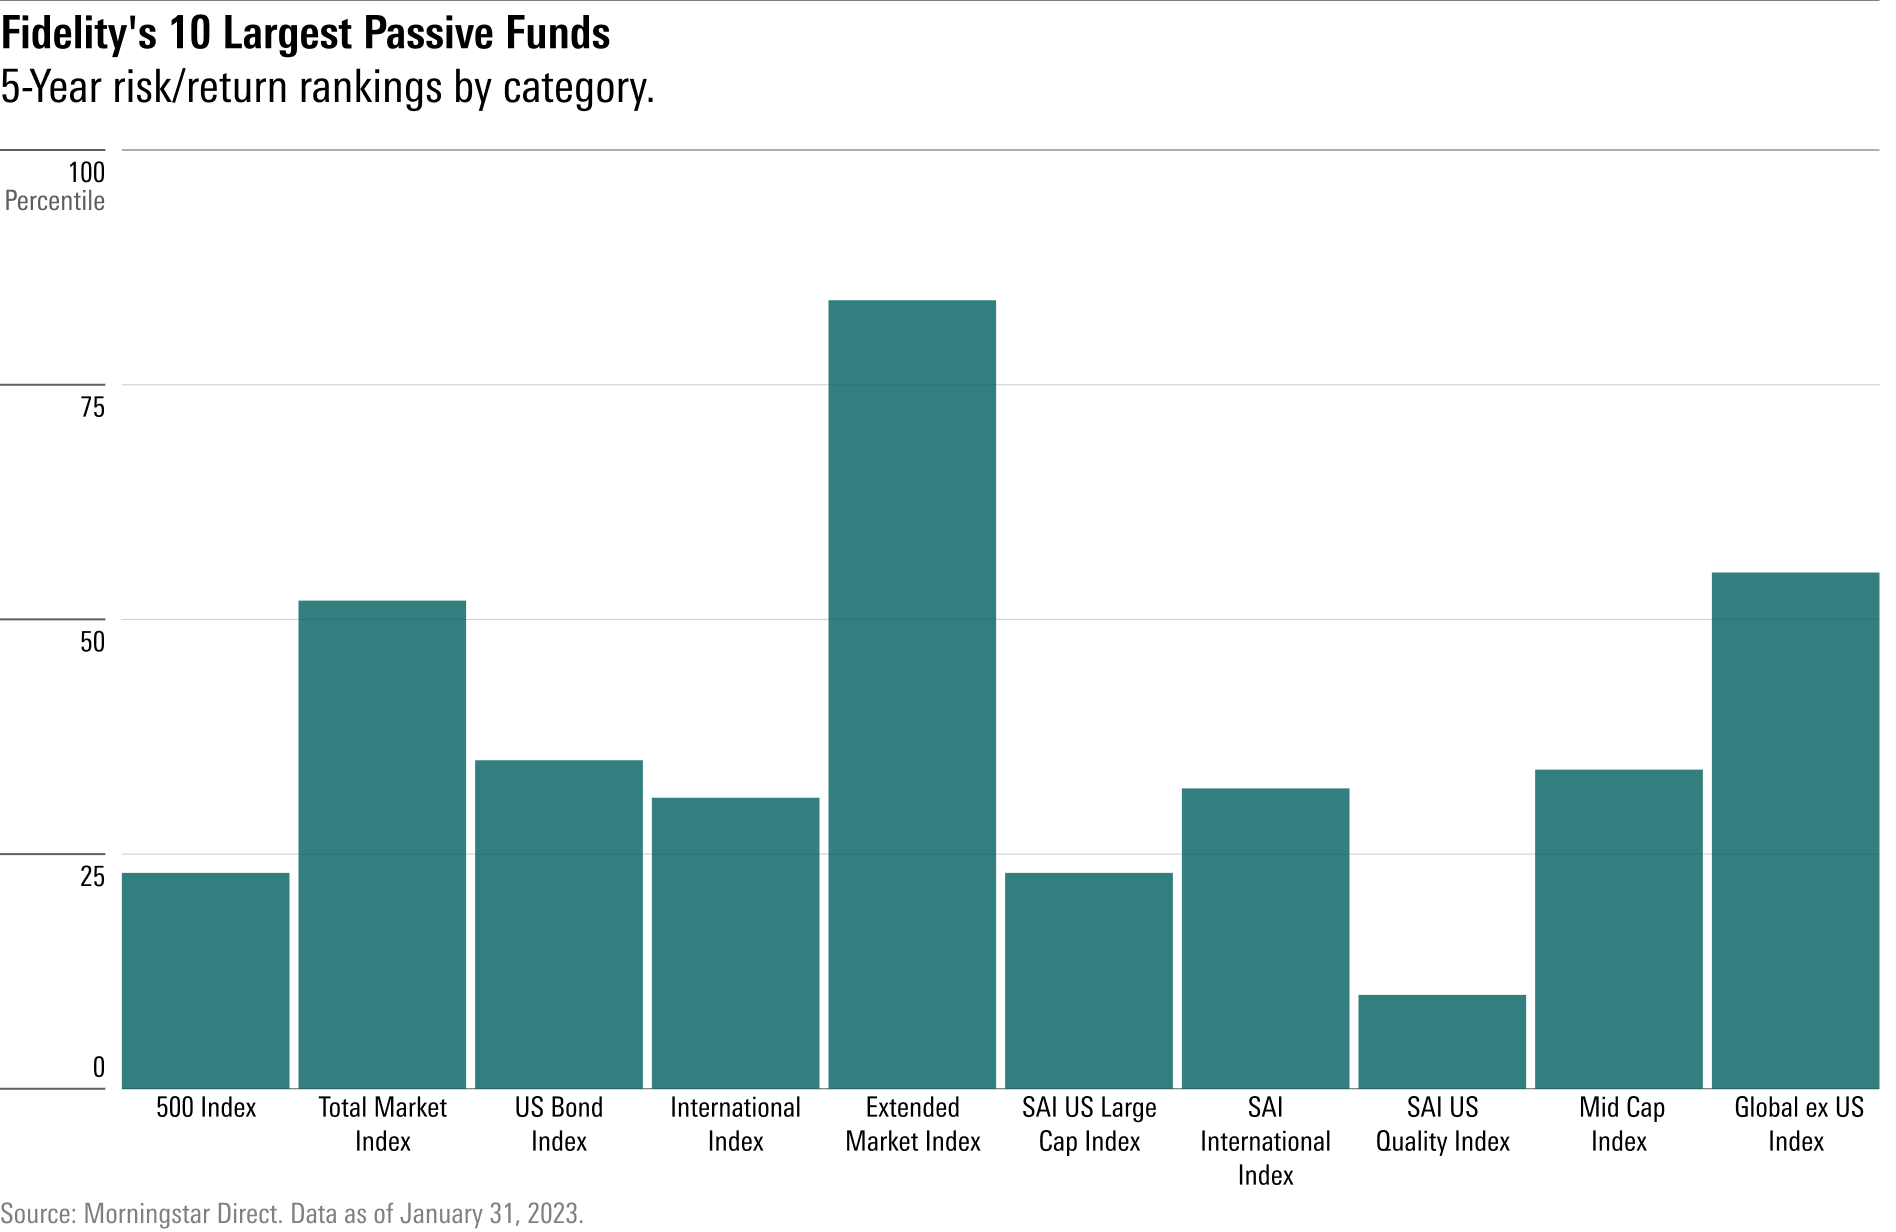
They are as one would have forecast. As with the other major fund companies, Fidelity’s passively managed funds have very low expense ratios, and therefore an ongoing cost advantage over their actively run rivals. For that reason, they will usually record above-average risk-adjusted returns (and raw total returns as well.) That expectation held for seven of the 10 funds, with two matching their category norms, and only one, Fidelity Extended Market Index FSMAX, falling well short of the mark.
It would be strange if this result did not closely mirror that of Vanguard’s passive funds, which have similar expense ratios and track similar indexes. And in fact, it does. Seven of Vanguard’s passive funds also posted above-average rankings. The only real difference between the two companies’ passive-fund results was that Vanguard had no dud—but that happened only because Vanguard Extended Market Index VEXMX lacked the assets to crack the Top 10 list.
The Active Funds
On to Fidelity’s actively managed funds, calculated in identical fashion:
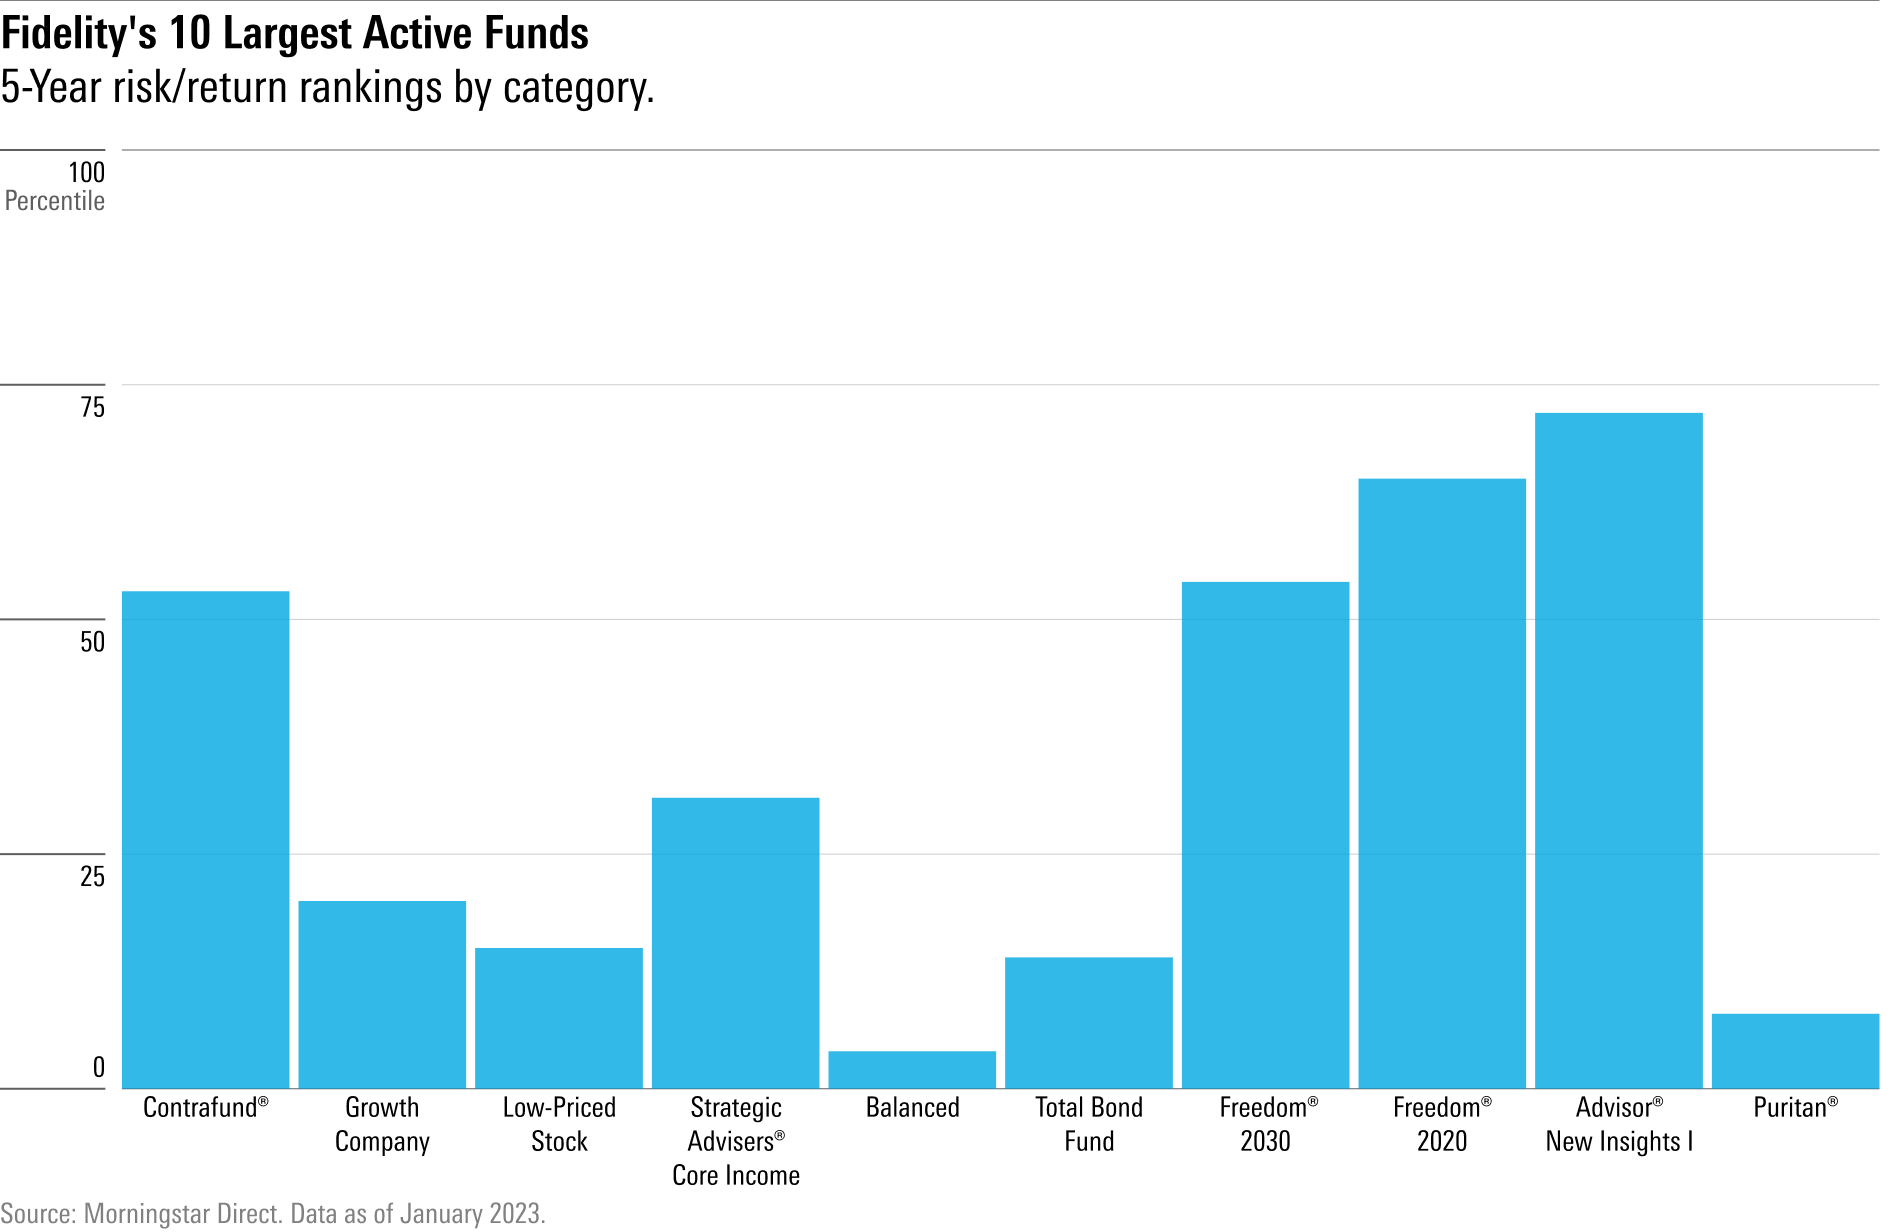
This chart looks somewhat different. It contains several notable successes. Whereas only one passive Fidelity fund placed inside its category’s top quintile, half the company’s 10 largest active funds managed the deed: Fidelity Growth Company FDGRX, Fidelity Low-Priced Stock FLPSX, Fidelity Balanced FBALX, Fidelity Total Bond FTBFX, and Fidelity Puritan FPURX. If fund risk-adjusted returns were random, such a feat would only be accomplished 3.3 times in every 100 trials.
While that accomplishment can (and should) be attributed to chance—although it’s worth noting that academic researchers commonly define the 5% mark as indicating “statistical significance,” albeit with a far larger sample size than 10—the performance of Vanguard’s active funds casts doubt on that interpretation. Half of them also landed in their category’s highest quintile. Thus, the two major fund companies that I have evaluated have each achieved 3.3% results, making for a once-in-900 outcome. Hmmm.
(A confession: Research isn’t that easy. Although that combination of rankings would randomly occur only one time in 900 observations, many other ranking combinations—such as three top-decile showings, or nine top-half performances—would also suggest investment success. Thus, even though the 0.11 percentage seems convincing, I regard these results as suggestive rather than conclusive.)
The news for Fidelity’s active funds was not uniformly positive, though. While none landed in the bottom quartile, Fidelity Freedom 2020 FFFDX and Fidelity Advisor New Insights FINSX were below average, with Fidelity Contrafund FCNTX and Fidelity Freedom 2030 FFFEX at the median. Thus, four of the 10 active funds were middling, as opposed to none for Vanguard.
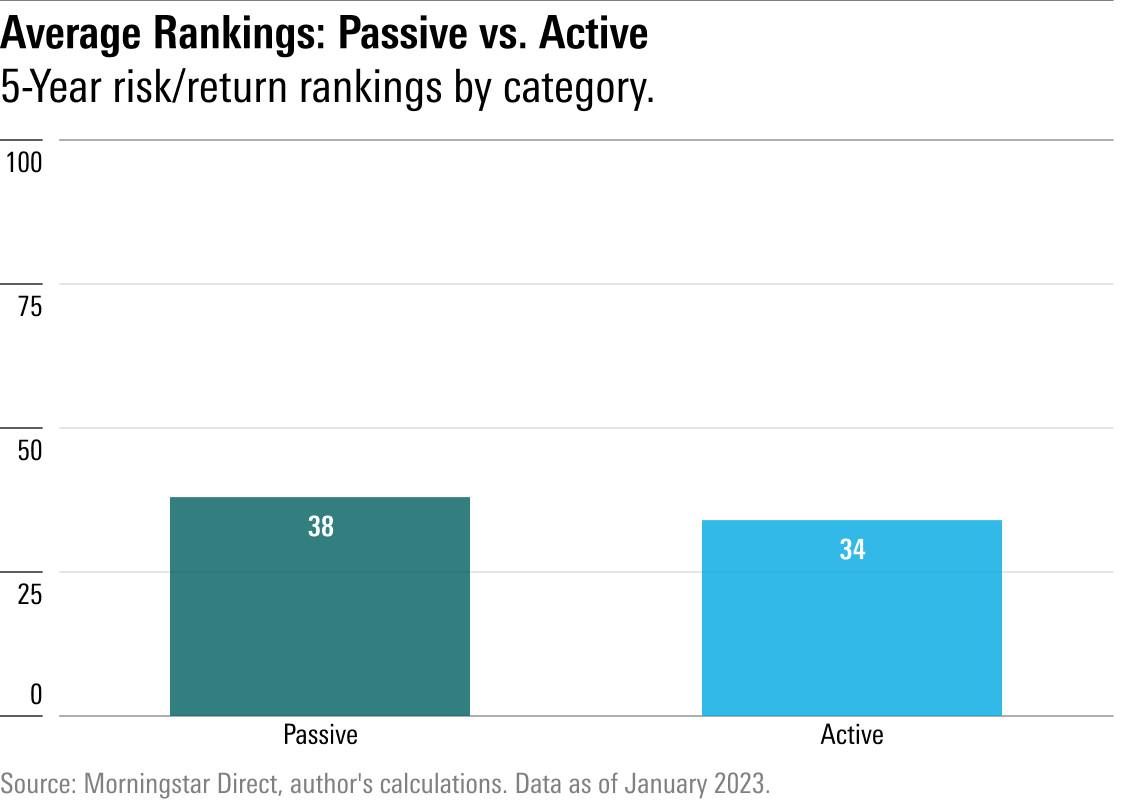
Consequently, Fidelity’s active funds did not mimic Vanguard’s by scoring a clear victory over their passively managed siblings. In all, their risk-adjusted category rankings were slightly better, but that victory was counterbalanced by the fact that one fewer active fund notched an above-average result. Call it a draw.
Shareholder Reactions
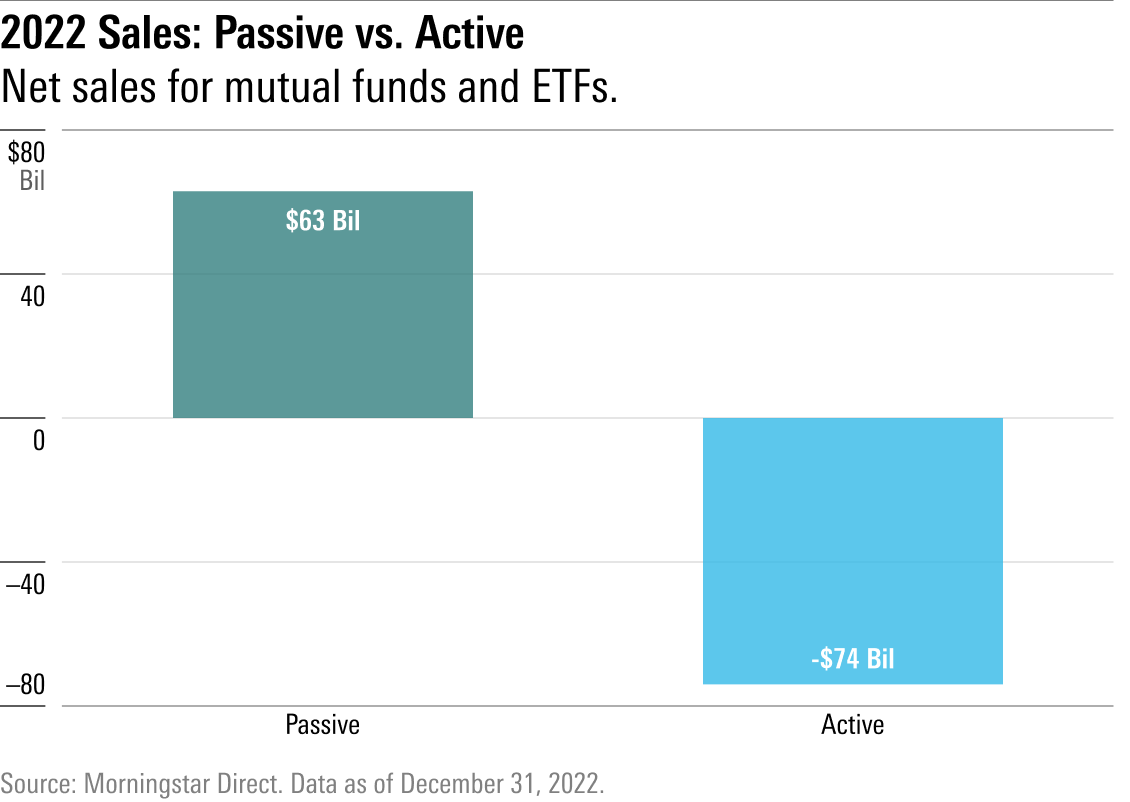
The sales figures have been another matter altogether. As with both the overall industry trend and Vanguard’s experience, Fidelity’s passive funds have enjoyed robust sales, while its active funds have undergone net redemptions. For example, in 2022, the company’s passive funds received a net $63 billion, while its active funds had outflows of $74 billion. The performances of the two groups may have been skin, but investor preferences were not.
Summary
That Vanguard’s active funds have suffered net redemptions, despite their outstanding results, is understandable. For many years, Vanguard was the only fund company that sold directly to shareholders (DFA operated similarly but marketed through financial advisors) to offer a suite of index funds. The firm therefore attracted customers who preferred passive to active management. Such investors might well avoid actively run funds no matter their success.
Fidelity’s sales figures are tougher to explain. Although in recent years Fidelity has transformed its image from an organization that touted the excellence of its fund managers to one that emphasizes service and availability, it has not built its business on the back of passive investing. Presumably, many of Fidelity’s clients would be perfectly happy owning active funds if their results were competitive.
Such has not been the case. That decision is logical. For one, indexing is always a sound investment strategy. For another, Fidelity’s largest active funds, unlike Vanguard’s, have not performed well enough to earn unequivocal support. They have been as good as the firm’s passive funds but not outright better. Thus, to address this article’s opening question, “Should Fidelity investors just index?” Probably yes, in most cases, for simplicity’s sake. But they need not do so.
The author or authors do not own shares in any securities mentioned in this article. Find out about Morningstar’s editorial policies.
The opinions expressed here are the author’s. Morningstar values diversity of thought and publishes a broad range of viewpoints.

 United States