
TIPS vs. Balanced Portfolios for Income: The History
2 ways to seek rising payouts.


The Upshot
Over the past month, I have written twice about Treasury Inflation-Protected Securities. One column discussed “TIPS ladders,” which devour TIPS entirely, principal and all, while the other column included TIPS in a broad survey about guaranteed income. Today’s article is different. It evaluates the fate of investors who, 10 years ago, bought 30-year TIPS as an ongoing source of rising income, rather than as a ladder. What if they had bought a stock/bond portfolio instead?
To jump to the conclusion: The balanced portfolio would have been the better investment for three reasons. In winter 2012, 30-year TIPS were costly. They have since become cheaper. Strike one against TIPS. Until the final 18 months of the decade, the inflation protection offered by TIPS was moot because prices were flat. Strike two. Finally, the stock market performed well over the past decade, thereby boosting the capital base of the balanced portfolio. Strike three.
Although the outcome is obvious, it’s worth examining the details. Over the past 10 years, conditions favored balanced funds. They may not do so during the next decade. Measuring the extent of TIPS’ failure will help to establish the conditions under which they might succeed—the topic of next week’s sequel to this column.
Percentage Yields
Assume three investments—
1) A balanced portfolio that divides its assets equally between U.S. equities and one-year Treasuries
2) A portfolio of 30-year TIPS, carrying today’s price of a 1.68% real yield
3) A portfolio of 30-year TIPS, carrying their historic price of a 0.43% real yield (that is, their price on Dec. 1, 2012, when the study begins)
The two versions of TIPS prices fulfill different needs. Today’s TIPS price is relevant for future projections; it alone will be used in next week’s column. However, the historic price is necessary to explain what already has occurred.
The following chart shows the yield for the three portfolios per the conventional presentation, as an annualized percentage of the portfolio’s value.
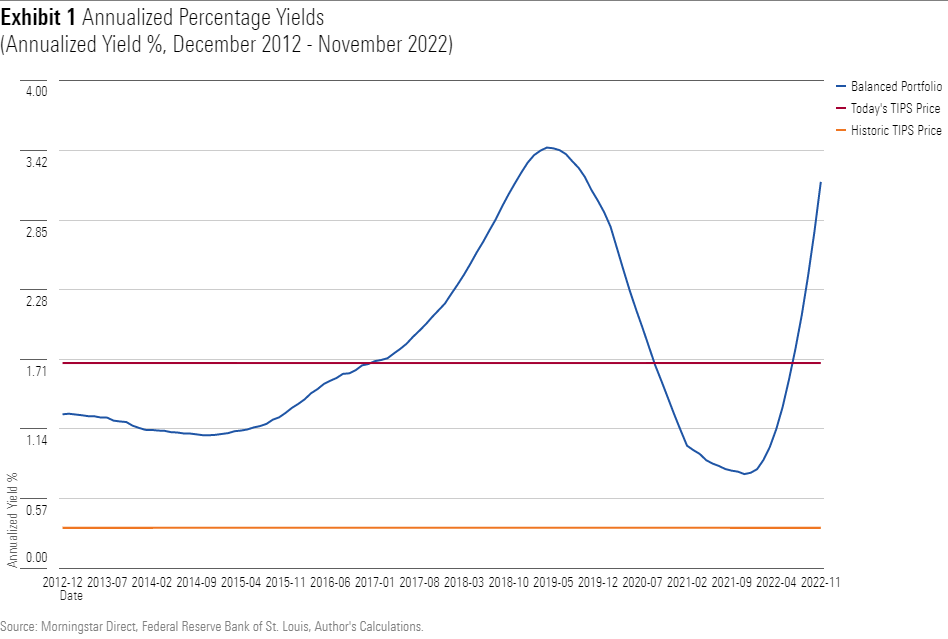
By this measure, the yields for the balanced portfolio and the TIPS portfolio at today’s prices have been similar. (In contrast, the yield from TIPS at historic prices has been distressingly puny; what were those investors thinking?). Overall, the balanced portfolio appears to possess a slight edge over TIPS that carry today’s prices, thanks to its late 2010s’ bulge, but the battle is tight.
That picture, however, is incomplete because it ignores capital growth. Unlike conventional bonds, TIPS grow their principal, which tracks the rate of inflation. Thus, although the real yields on TIPS remain fixed, their cash payments gradually increase. The same logic applies to balanced portfolios, assuming the stock market rises. (I assume no fixed-income gains for the balanced portfolio, as each year it buys a fresh batch of one-year Treasury notes that it holds until maturity.)
Dollar Yields
The next chart corrects that oversight by presenting each portfolio’s monthly dollar payments.
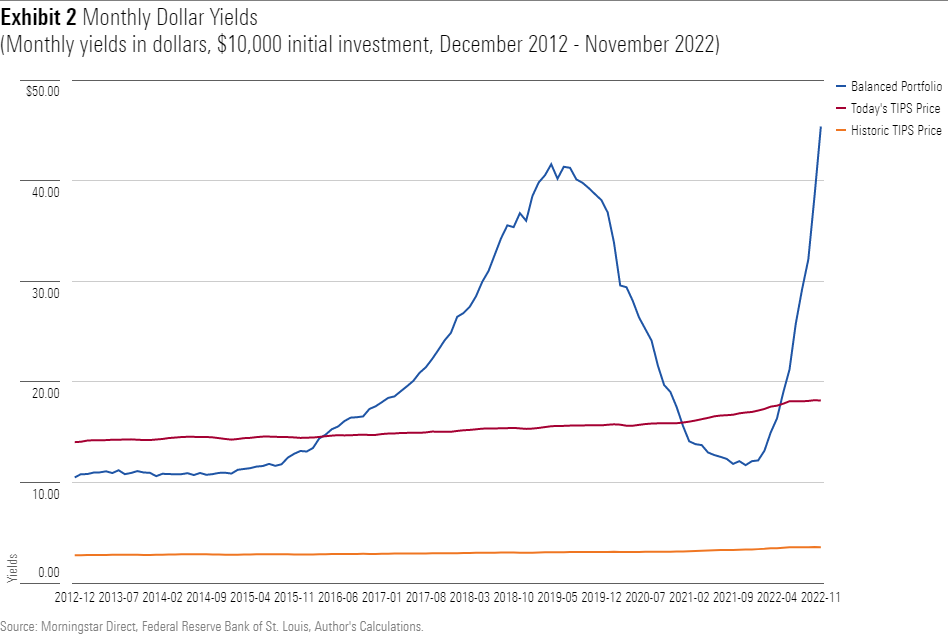
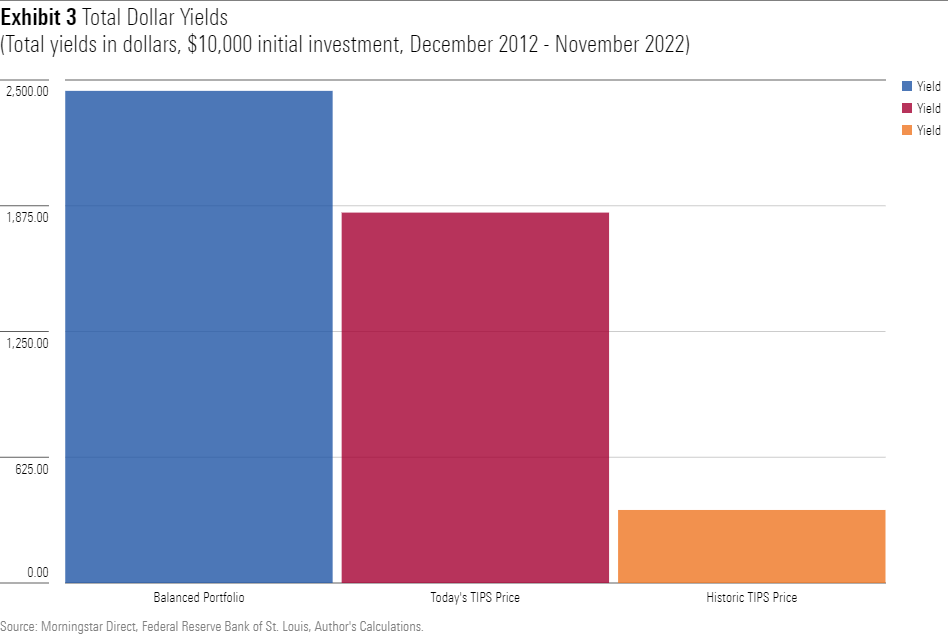
The pattern is the same as before but not the magnitude. Measuring yield by dollars rather than percentages reveals the balanced portfolio’s advantage: During the period studied, its capital base handily outgrew the rate of inflation. (As a reminder, all those gains owed to the portfolio’s stock performance, as the fixed-income investments provided no appreciation whatsoever.) Consequently, its cash distributions ballooned, such that the balanced portfolio now pays $45 per month, as opposed to $18 for the TIPS portfolio that uses today’s real yield. (The historic TIPS portfolio supplies a piddling $3.56.)
The next chart summarizes the previous chart’s findings. Its “total dollar yield” represents the sum of the cash distributions paid by each portfolio.
Total Returns and Risk
So far, I have not discussed total returns and risk. Although they are the primary benchmarks for assets held for accumulation, such as 401(k) accounts, those measures are a secondary concern for this column’s hypothetical investor. What matters most is reliable income—a stream of cash that grows over time, thereby maintaining (or perhaps even increasing) purchasing power. Yield rules.
Nevertheless, the risk/return trade-off deserves a look. We know that, besides its yield advantage, the balanced portfolio also recorded higher total returns than did either of the TIPS portfolios. It could not help but do so, since it enjoyed both greater capital growth and higher income. But perhaps along the way the balanced portfolio also courted far greater risk. If so, it might have been less attractive to cautious investors, despite its better total returns and income.
That was very much not the case, as measured by conventional statistics. The table below provides the 1) afterinflation total returns and 2) standard deviations, in each case annualized, for the balanced portfolio and TIPS at their historic price. No contest. Not only did the TIPS post lower returns, as we already well knew, but they were substantially more volatile.
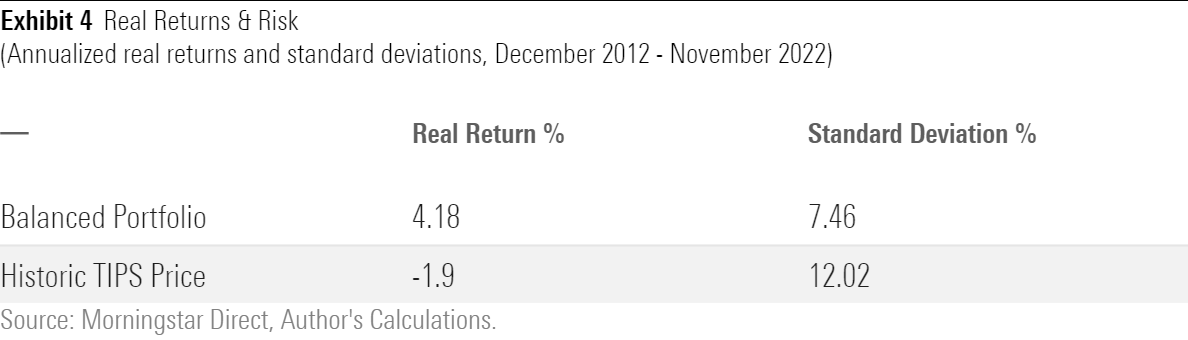
(For this exercise, I omitted TIPS at today’s prices because assuming how they would have traded, given their higher real yields, was a step too speculative even for my back-of-the-envelope methods. But roughly speaking, they would likely have recorded similar standard deviations, with significantly higher total returns—although not high enough to catch balanced funds.)
These results should not greatly faze TIPS owners. After all, these portfolios are created to be held, not traded. Also, while standard deviations capture one key element of risk—the chance of receiving a low price for a security, should its owner be forced to sell—they miss another element. No matter what happens with inflation, the TIPS investor is protected. The possibility of inflation is also a key risk, albeit one that is not captured by conventional investment statistics.
Next week, we will run through what combination of real TIPS yields and stock/bond market performances would make TIPS the superior future investment.
The author or authors do not own shares in any securities mentioned in this article. Find out about Morningstar’s editorial policies.
The opinions expressed here are the author’s. Morningstar values diversity of thought and publishes a broad range of viewpoints.

 United States