
Are Active Stock Funds Lagging Because…They’re Funds?
New research finds a handful of stocks drove market returns. Open-end funds aren’t really built for that.

Summary
- New research finds that a very small number of stocks accounts for most of the US equity market’s historical returns; that trend appears to have intensified in recent years.
- A hypothetical portfolio built with perfect foresight, that is, containing the winningest stocks, would have done exceptionally well but tested investors’ patience and resolve along the way.
- A know-nothing/do-nothing portfolio that bought the entire S&P 500 without any regard for which stocks might outperform in the future still exploited the positive skewness of stock returns, suggesting indexers also benefit from this phenomenon.
- In an experiment of 1,000 randomly chosen 50-stock portfolios, there was a clear correlation between the number of “mega-compounders” and returns, but the most successful portfolios ended up being very concentrated in their best-performing stocks.
- This could present a challenge to active fund managers who can’t or won’t let their winners run because of the stigma associated with, and rules prohibiting, heavy concentration.
‘One Hundred Years in the US Stock Markets’
Does the open-end fund structure doom many active stock fund managers to fail?
I’m being a little facetious, but I’ll admit it’s a question that ran through my head as I read an updated study of historical US stock returns that Arizona State University Professor Hendrik Bessembinder published recently.
Bessembinder finds that a handful of names accounted for nearly half the wealth US stocks created over the past century. Here’s the money table from the updated paper:
"One Hundred Years in the U.S. Stock Markets" by Hendrik Bessembinder
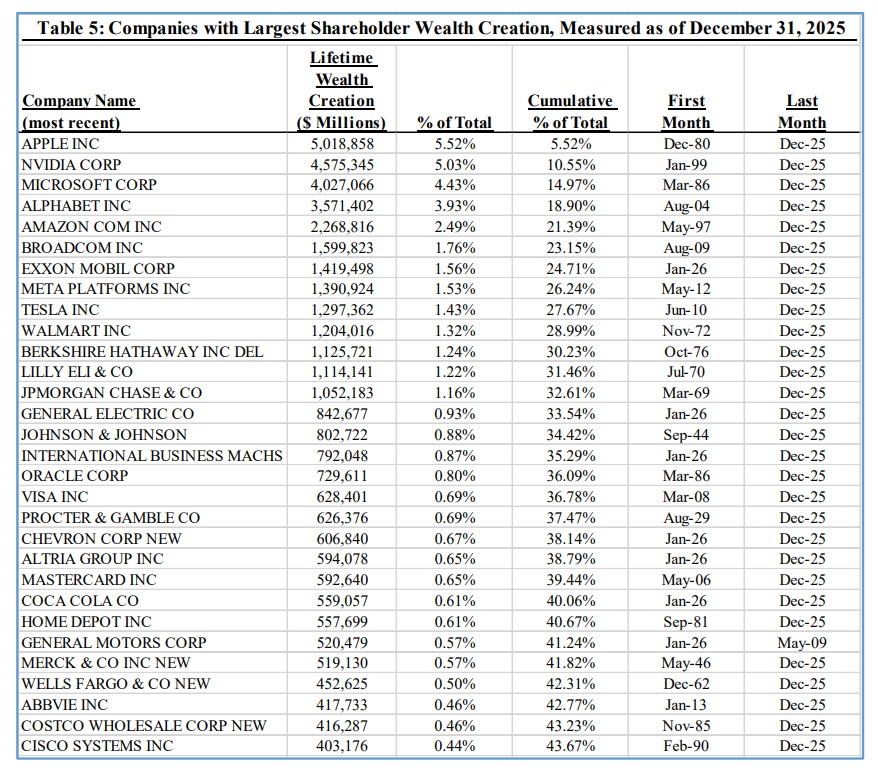
If a small number of hyper-compounders carried the market, the corollary is there were many stocks that lost money (52% of the 29,081 he analyzed) or had pedestrian returns (59% underperformed cash). This explains a remarkable dichotomy—the average stock gained a cumulative 30,621% over the 100-year period, but the median stock lost 6.9%.
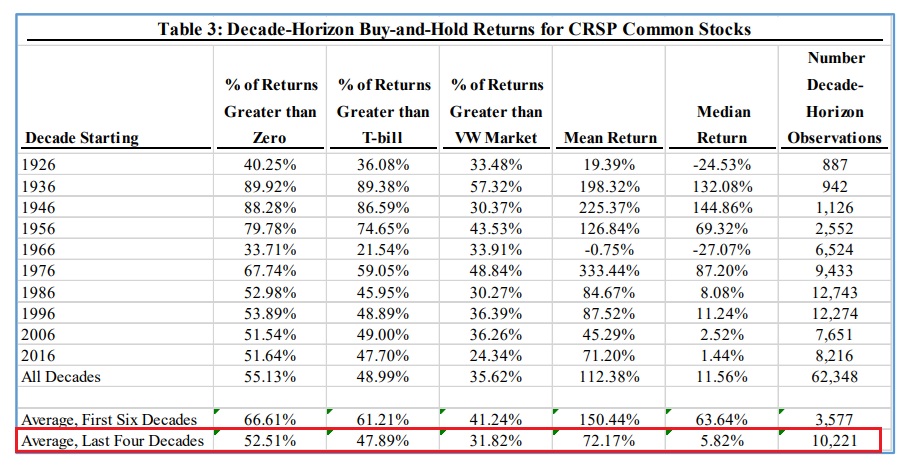
If anything, it appears this “positive skewness” has gotten more pronounced as time has gone on. That’s evident in this table from the paper, which compares the distribution of returns by decade, finding fewer stocks have made money or beaten cash in the past four decades than did over the previous 60 years.
"One Hundred Years in the U.S. Stock Markets" by Hendrik Bessembinder
As if to punctuate that point, Bessembinder also compiled a list of the top 30 stocks by amount of cumulative wealth created since 2016, finding they collectively accounted for more than 61% of all wealth created.
"One Hundred Years in the U.S. Stock Markets" by Hendrik Bessembinder
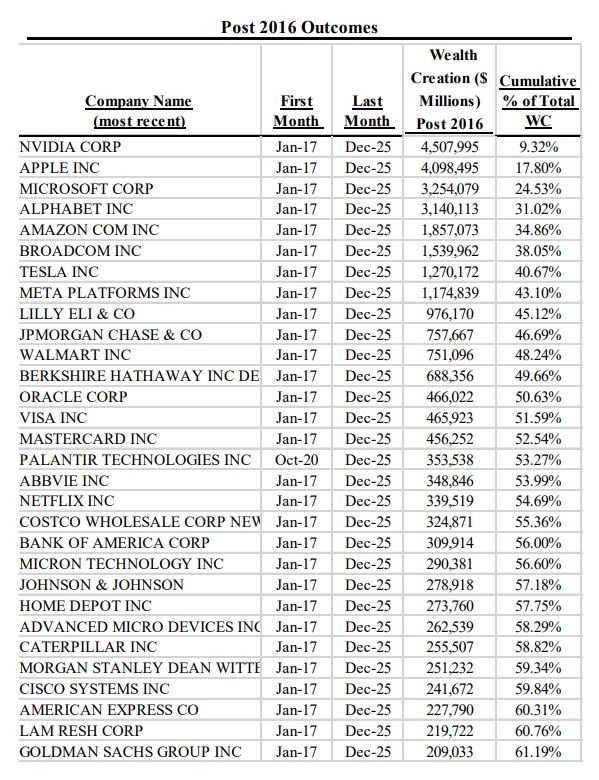
In other words, this list represents the near-pinnacle of what could have been achieved through stock-picking over this nine-year period.
The Perfect Portfolio
In a September 2024 interview, my colleague Christine Benz asked Professor Bessembinder about the implications of his prior findings—which this recent study seems to only further reinforce—for active investors and indexers. Here’s that exchange:
Benz: It seems like the study is kind of a Rorschach test. Some people think it underscores the futility of active investing. Others have drawn the opposite conclusion, and they’ve used your findings to poke holes in the argument for indexing. So, where do you come down on that?
Bessembinder: Well, this may sound a little wishy-washy, but I come down on both sides of that argument. I think that my study provides new ammunition for both sides of the argument. One way of summarizing it is that for those people who were already inclined to think that the best strategy is diversify, buy and hold, my study gives them some new ammunition in support of that. On the other hand, for those people who think that they should be active investors, my study gives them some new ammunition. I’m not sure it has changed anybody’s mind. I’m not sure it’s moved anybody from one camp to the other, but it’s given people in each camp some additional reason to think that they’ve got the right position.
For the people who favor broadly diversified portfolios, the new information, everything that’s in the textbooks, everything you’ve already read about the benefits of diversification still holds. But on top of that, you’ve now got the point, if you just pick a few stocks at random, the odds are against you. It’s more than 50-50 that you’ll underperform the market if you just pick a few stocks at random. That’s the nature of skewness. Most of the stocks are going to underperform the average, and the market’s going to deliver the average. So, that’s some additional ammunition for the people on the diversify side.
For people on the other side, first of all, there’s what economists call skewness preference. That is a preference for the possibility of a big-winner outcome. Having skewness preference is not irrational. Economists can’t say that’s an irrational way to think about the world. Diversifying reduces risk as measured by something like standard deviation. Diversification also reduces skewness. So, if skewness is what you want, if the possibility of a really big outcome is what you want, my study shows that you’d prefer to be less diversified.
"Hendrik Bessembinder: ‘Do Stocks Outperform Treasury Bills?’"; The Long View podcast; Sept. 10, 2024
Given Bessembinder’s comments, I thought it would be interesting to run a simple, if somewhat fanciful, experiment: Imagine one had the foresight to buy the 30 biggest wealth-creating stocks as of Dec. 31, 2016, and then hold them for the next nine years. How would that have played out, practically speaking? (Hat tip to Wes Gray for inspiring the idea.)
To be sure, we already know you’d have ended up doing phenomenally well: Left untouched, an equally weighted portfolio of these stocks (excluding Palantir, which IPO’d subsequently) would have gained 30.5% per year by Dec. 31, 2025, double the S&P 500.
Growth of $10,000: Bessembinder Stocks Versus S&P 500 Index
However, the portfolio’s quirks probably would have had you feeling at least a little queasy. For instance, consider what the portfolio would have looked like at the outset:
Bessembinder Stocks: Style-map as of Dec. 31, 2016
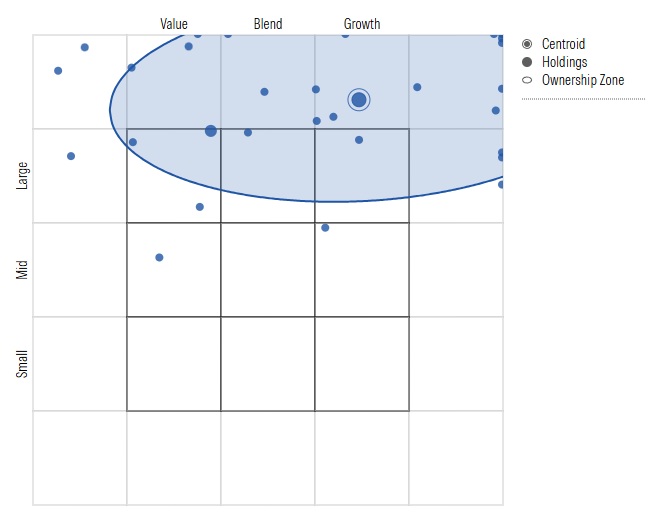
That’s not your mama’s equity fund. Whereas the typical stock fund held 77 positions on that date, this portfolio would have spread its assets over less than half as many names (by definition, as there were only 30 stocks on Bessembinder’s list). And they weren’t all the usual growth staples, with about one-third of assets stashed in value stocks.
Style Analysis: Bessembinder Stocks Versus Average Large Growth Fund (as of Dec. 31, 2016)
Those eccentricities aside, there’s also the matter of trading. You wouldn’t be doing any. No rebalancing, trims, or adds. Why? In this scenario, you’re aiming to profit as much as possible from positive skewness and thus would want to give outperformers a long leash.
That’s a far cry from the buying and selling professional fund managers normally do: The typical active US stock fund manager turns over about half his portfolio each year.
Distribution of Active US Equity Funds by Average Turnover Rate (2017-25)
Then there’s risk management—position caps, sector limits, and so on—there’d be none of that, either. That would have meant tolerating outsize stakes in the portfolio’s biggest winners—Nvidia (22.3% of the portfolio by Dec. 31, 2025), Tesla (9.9%), Broadcom (7.8%), Advanced Micro Devices (5.9%), and Lam Research (5.8%).
Bessembinder Stocks: Time-Lapse of Top Holdings' Weights
Thus, you’d have been in for a bumpy ride: The portfolio would have been about 1.5 times more volatile than the S&P 500 over the nine-year period. It also would have lost nearly 40% of its value in 2022 and seen deeper drawdowns than the market in 2019 and 2025.
Bessembinder Stocks: Maximum Drawdown Versus S&P 500 (Jan. 1, 2017 to Dec. 31, 2025)
Which is to say: Based on this experiment, even the canonically “perfect” stock portfolio would have demanded resolve and not a little nerve to reap the rewards.
Right (Tail) Under Your Nose
Now, how about the opposite: Imagine you had no foresight into which stocks would drive returns. So, instead of trying to pick any, you just spread your bets out among hundreds of stocks. As in the previous experiment, you wouldn’t do any buying, selling, or risk management. You’d be letting it roll, but this time across a much larger basket of stocks.
How would that have gone? To assess that, I estimated the S&P 500’s performance assuming it was left untouched from Dec. 31, 2016, until Dec. 31, 2025. I found this “do-nothing” portfolio would have gained 15.0% per year, just 0.1% shy of the index’s return.
Growth of $10,000: Hypothetical 'Do-Nothing S&P 500 Portfolio' Versus Actual S&P 500 Index
For a do-nothing strategy, that’s a good showing, especially when you consider it was less volatile than the benchmark. In fact, the do-nothing portfolio’s risk-adjusted returns would have beaten nearly 80% of all active large-cap funds, before fees, over this nine-year span.
What made the difference? I broke the do-nothing portfolio return into two components: (1) the returns attributable to the “Bessembinder stocks” that drove wealth creation and (2) everything else. Here’s what that picture looked like.
Breakdown of the 'Do-Nothing S&P 500 Portfolio' Return: Bessembinder Stocks Versus All Other Stocks
Though the Bessembinder stocks together represented only around one-quarter of the S&P’s weight at the start, they accounted for more than half of it by the end. That’s because those stocks dramatically outperformed the other stocks, as shown below.
Annual Returns: Bessembinder Stocks Versus All Other Stocks Versus S&P 500 Index
(Note that the actual S&P added and deleted names during this nine-year period and various corporate actions could have shifted stocks’ weights in ways a “do-nothing” hypothetical wouldn’t reflect.)
In summary, this experiment shows you didn’t have to go to heroic lengths to exploit the “positive skewness” Bessembinder found. That’s because it’s baked into the market return.
A Structural Problem
Which brings us back to the question where this piece began: Does the open-end fund structure doom many active stock fund managers to fail?
I’d written an article a few weeks ago where I found active large-cap stock funds’ aggregate stock picks would have outperformed the funds themselves if they’d simply been bought and held. The managers chose the right stocks, but their trades detracted from returns.
100 Largest Active US Stock Funds: 2025 Return vs. Aggregate Stock Holdings and Index
That seems to be at least somewhat congruent with one of the key implications of Bessembinder’s findings: Given the degree to which returns are positively skewed, it’s imperative to identify names that have the potential to be multibaggers and then hold on through thick and thin.
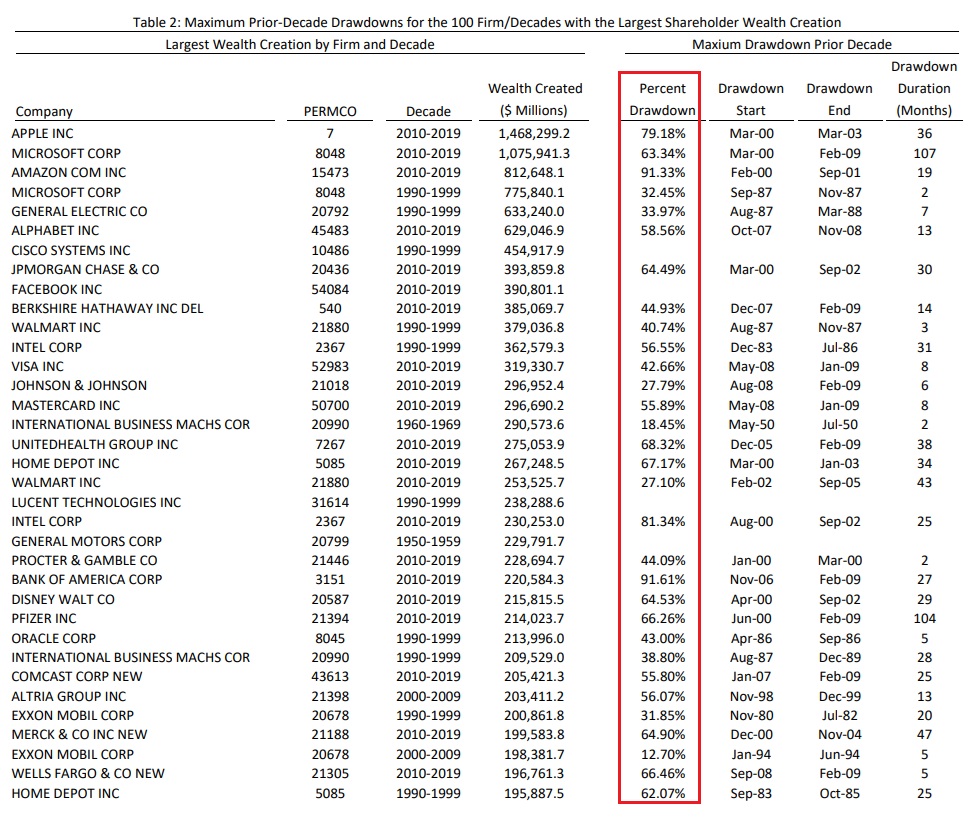
Which is easier said than done: Bessembinder has done other research, finding the most successful stocks also endured crushing drawdowns along the way. It’s at times like those that a future mega-winner can look indistinguishable from just another also-ran.
"Extreme Stock Market Performers, Part I: Expect Some Drawdowns" by Hendrik Bessembinder
Nonetheless, if managers are to exploit this skew, it will almost inevitably mean concentrating to a greater extent in individual holdings.
To illustrate, I ran a crude experiment in which I randomly chose 50 stocks from the S&P as of Dec. 31, 2016, weighting them based on their market caps as of that date, and then assumed they were left untouched until Dec. 31, 2025. I ran 1,000 trials in this fashion, tracking the distribution in the number of mega-compounding stocks chosen across the trials.
Distribution of Random Trials by Number of Bessembinder Stocks Held in Portfolio
As logic would suggest, it was most common for three Bessembinder stocks to pop up randomly in a trial (that is, there were 29 of these stocks in the S&P 500 as of Dec. 31, 2016, representing about 6% of the index; 6% of a randomly selected 50-stock portfolio works out to around three stocks).
Also, as one would expect, there was a correlation between the number of Bessembinder stocks picked in a random draw and that portfolio’s performance. The more mega-compounders a portfolio held, the higher its returns were on average and, thus, the likelier it was to top the S&P.
Average Return and Success Rate of Random Trials by the Number of Bessembinder Stocks
The average trial gained 14.5% per year over this nine-year period, with around 34.0% of trials topping the S&P 500 Index’s return over that span. This compared favorably to actual active US large-cap mutual funds—the average fund gained 14.3% annually before fees, with about 26.0% of those funds surviving to Dec. 31, 2025, and beating the S&P.
That said, there was a catch: The random portfolios that beat the S&P were heavily concentrated in their top holdings, as shown below.
Average Finishing Weight of Bessembinder Stocks in Successful Random Trials
(Note: The portfolios with fewer mega-compounding stocks had a greater concentration in those names by the end because they didn’t have to compete for weight with as many other mega-compounding stocks as was the case in other portfolios that held a greater number of these high-performing stocks.)
For instance, among the randomly built trial portfolios that ended up holding five Bessembinder stocks and beat the S&P, the average stock soaked up around 14% of assets by the end, meaning the five stocks accounted for around 70% of the whole portfolio in aggregate.
That’s tricky, as not only is that degree of concentration often frowned-upon in industry circles, it’s potentially against the rules: To qualify as a “registered investment company,” a fund must obey criteria that limit how much it stakes in an individual security (no more than 25%) and require spreading at least half of assets across positions that are 5% or smaller weights.
Between that stigma and the compliance barriers, it’s hardly a wonder that managers can’t or won’t hang onto big winners and that, in turn, is likely making it even more challenging for them to compete with the indexes. That is, the problem seems to be at least partly structural.
Caveat
To be fair, the empirical case for concentrating is not especially strong. That’s been true not just here in the US but also among active funds in markets abroad where market concentration can be even more pronounced. In addition, my colleague Jack Shannon has done interesting research finding that managers who take big positions in stocks have tended to fare poorly, as well as another analysis that suggests managers don’t hit for high average.
To state the obvious, managers who focus on a handful of stocks run a countervailing risk—missing out on the big winners—whereas those that cast a wider net boost their odds of picking up at least a few mega-compounders. And, indeed, some of the most durably successful funds—like Fidelity Growth Company for instance—have struck a balance between spreading their bets and giving surging holdings like Nvidia enough runway.
But it hasn’t been commonplace, with frequent turnover among active fund managers possibly arresting hyper-compounding that might otherwise have taken place. Bessembinder’s research seems to underscore the importance of identifying a handful of mega-gainers and holding on.
While that approach doesn’t demand concentration to succeed, it’s likely to result in it eventually, with all the attendant questions of whether that’s compatible with the open-end fund structure and well-engrained notions of what it means to run equity money prudently.
Switched On
Here are other things I’m reading, watching, or listening to:
- Amen: “Alternatives in 401(k)s Are a Solution in Search of a Problem”
- Tom Brakke’s bi-weekly round-up of musings on investing and finance
- “The Endless Goodbye”
- “What Were Bob Dylan and John Lennon Really Saying in the Back of That Limo?”
- “Inside a Corporate Retreat That Went Very Badly Wrong”
- Noah Cyrus and Ella Langley: “Way of the World”
Don’t Be a Stranger
I love hearing from you. Have some feedback? An angle for an article? Email me at jeffrey.ptak@morningstar.com. If you’re so inclined, you can also follow me on Twitter/X at @syouth1, and I do some odds-and-ends writing on a Substack called Basis Pointing.
The author or authors do not own shares in any securities mentioned in this article. Find out about Morningstar’s editorial policies.

 United States