
The 2 Forces Driving Markets Higher in 2025
Why markets continue to rise despite seeds of doubt.


Many traditionally accepted market patterns and economic connections aren’t holding up as well as they used to. For example, gold is up big, but so are US and international stocks. Additionally, gross domestic product growth remains robust despite an abrupt end to the free-trade era.
Both optimism and pessimism helped several asset classes reach new highs in 2025. Cautious sentiment is driving defensive asset classes higher, while artificial intelligence mania and rate cut expectations are fueling growth in riskier segments. The result is broad-based asset price growth and stretched valuations.
This quarter’s Markets Observer highlights these trends and other important developments from the third quarter of 2025.
Artificial Intelligence and the Economy
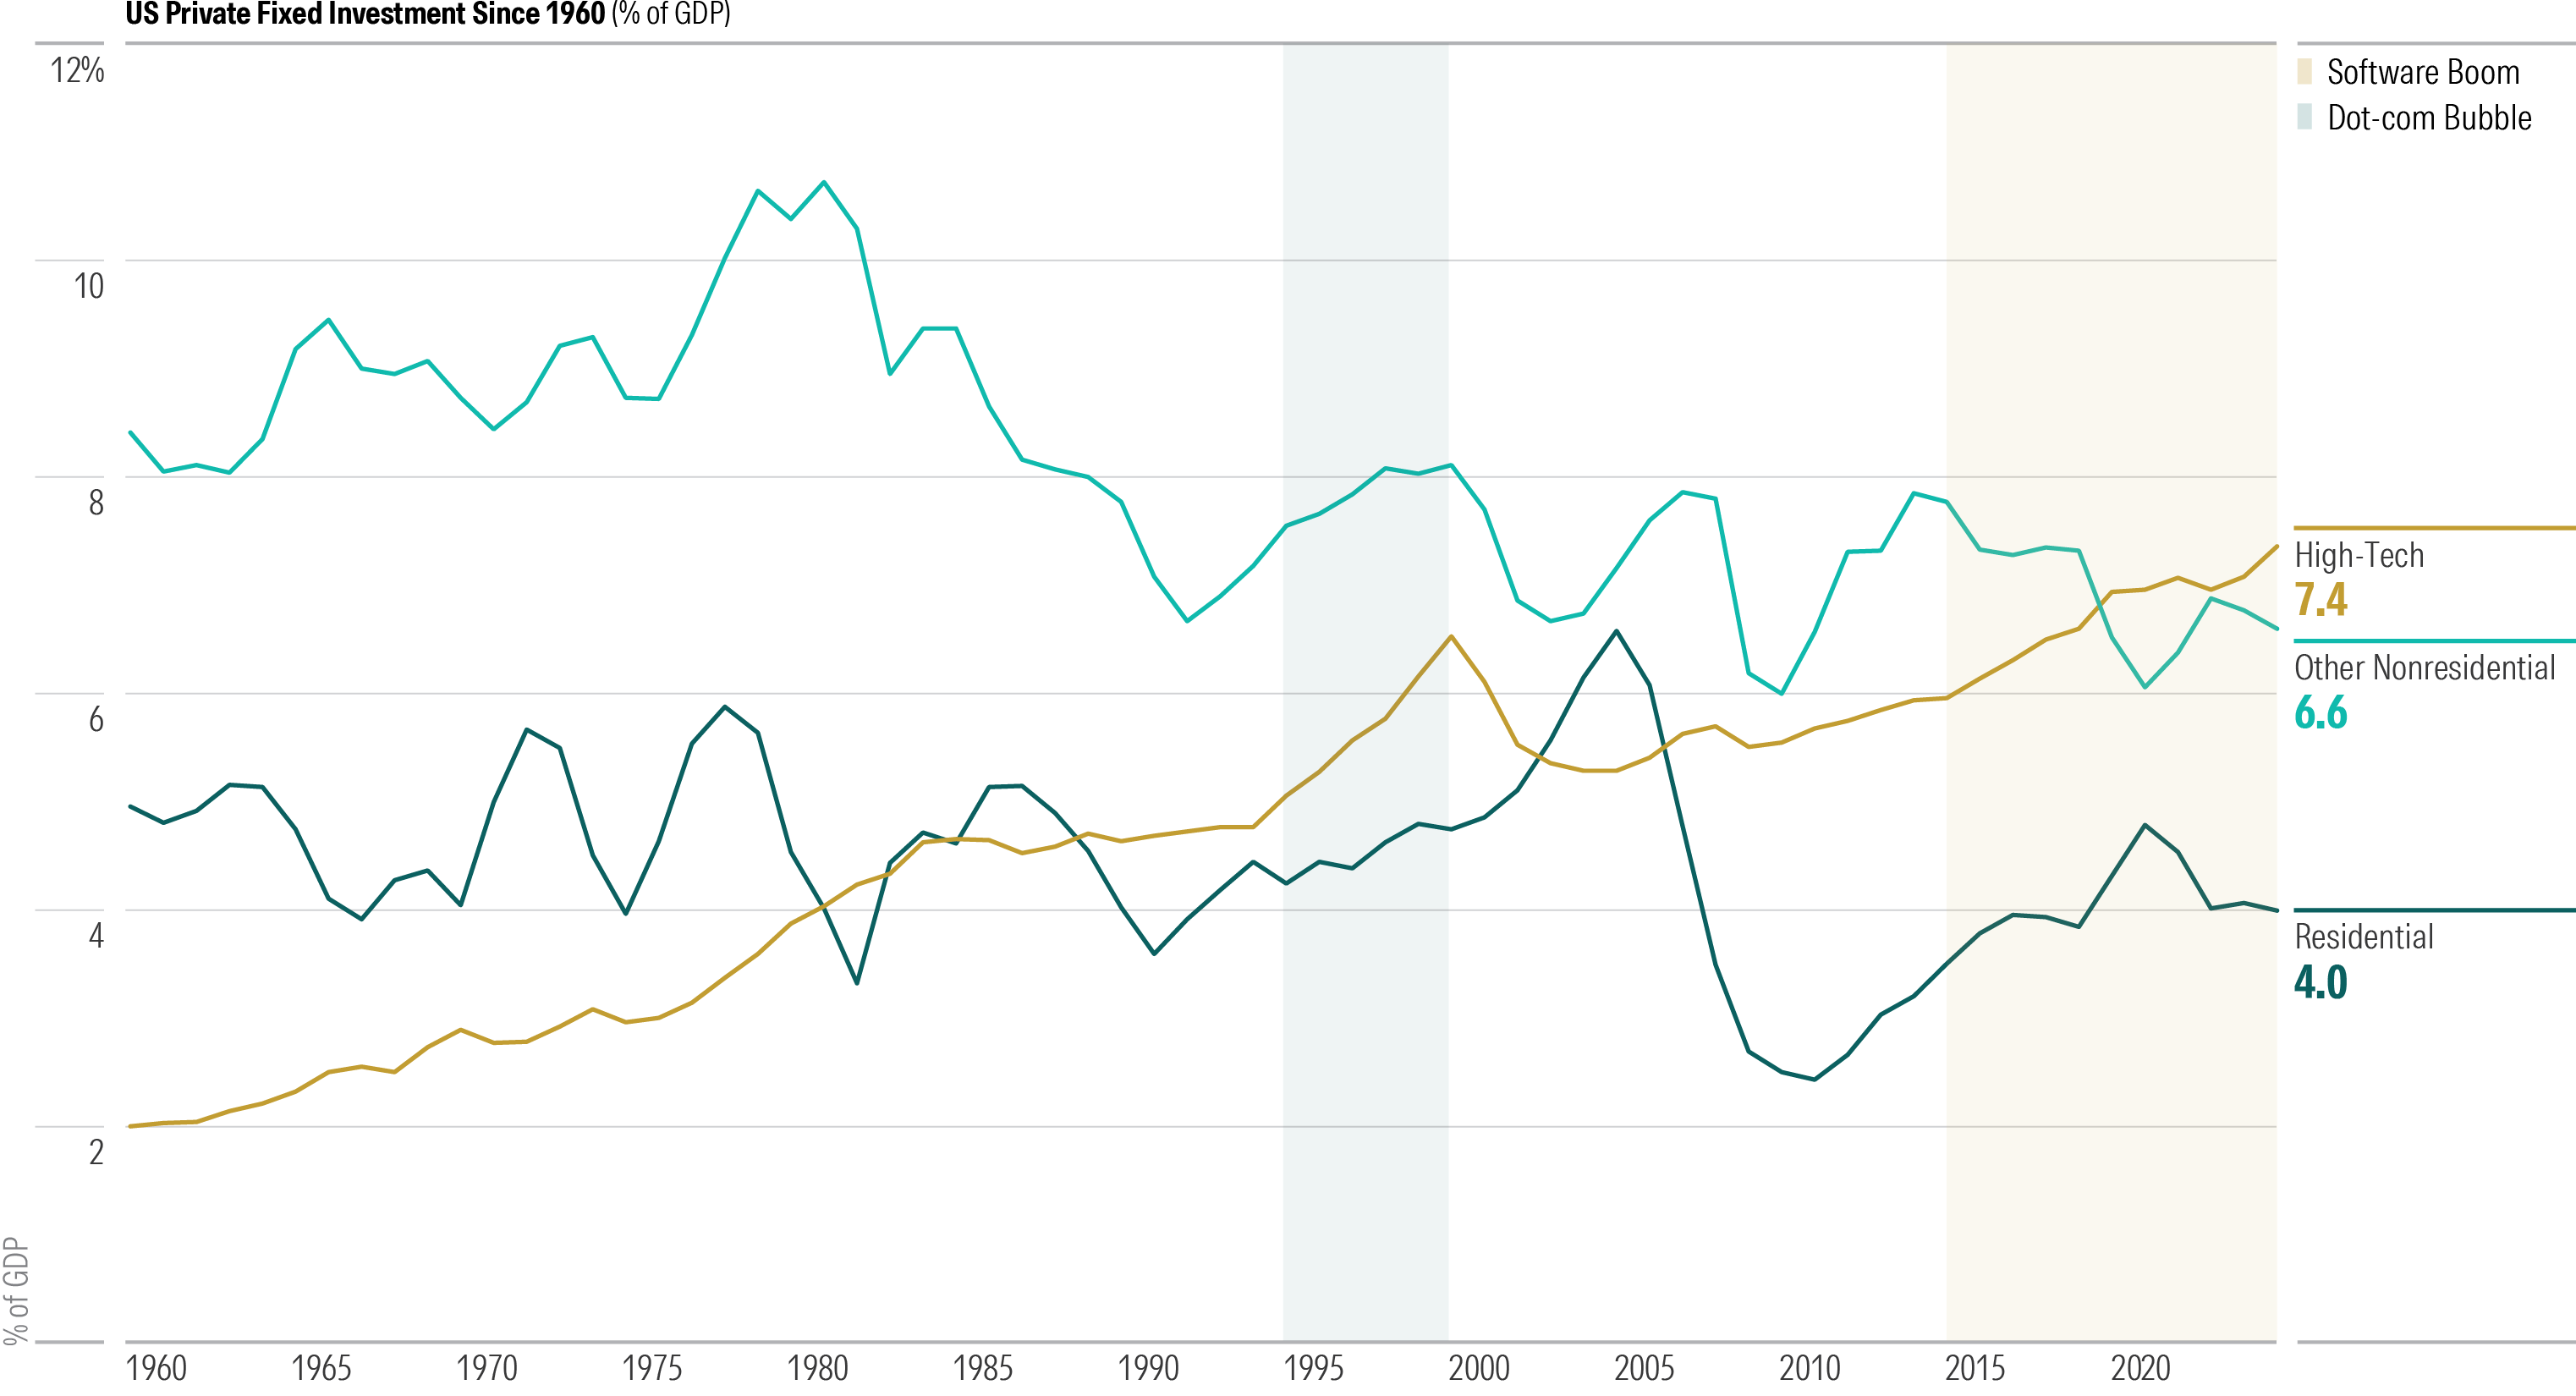
One of the biggest stories of 2025 has been relentless spending on artificial intelligence. Morningstar’s senior US economist, Preston Caldwell, points out that “the AI boom is not a step change, merely a continuation of the upward trend in tech-related spending that began in the mid-2010s.” The chart below shows that the share of US GDP spent on high-tech investment is now well in excess of the dot-com-bubble peak.
US High-Tech Investment Is at Record Highs
There are optimistic and pessimistic narratives surrounding AI and its impacts on the US economy.
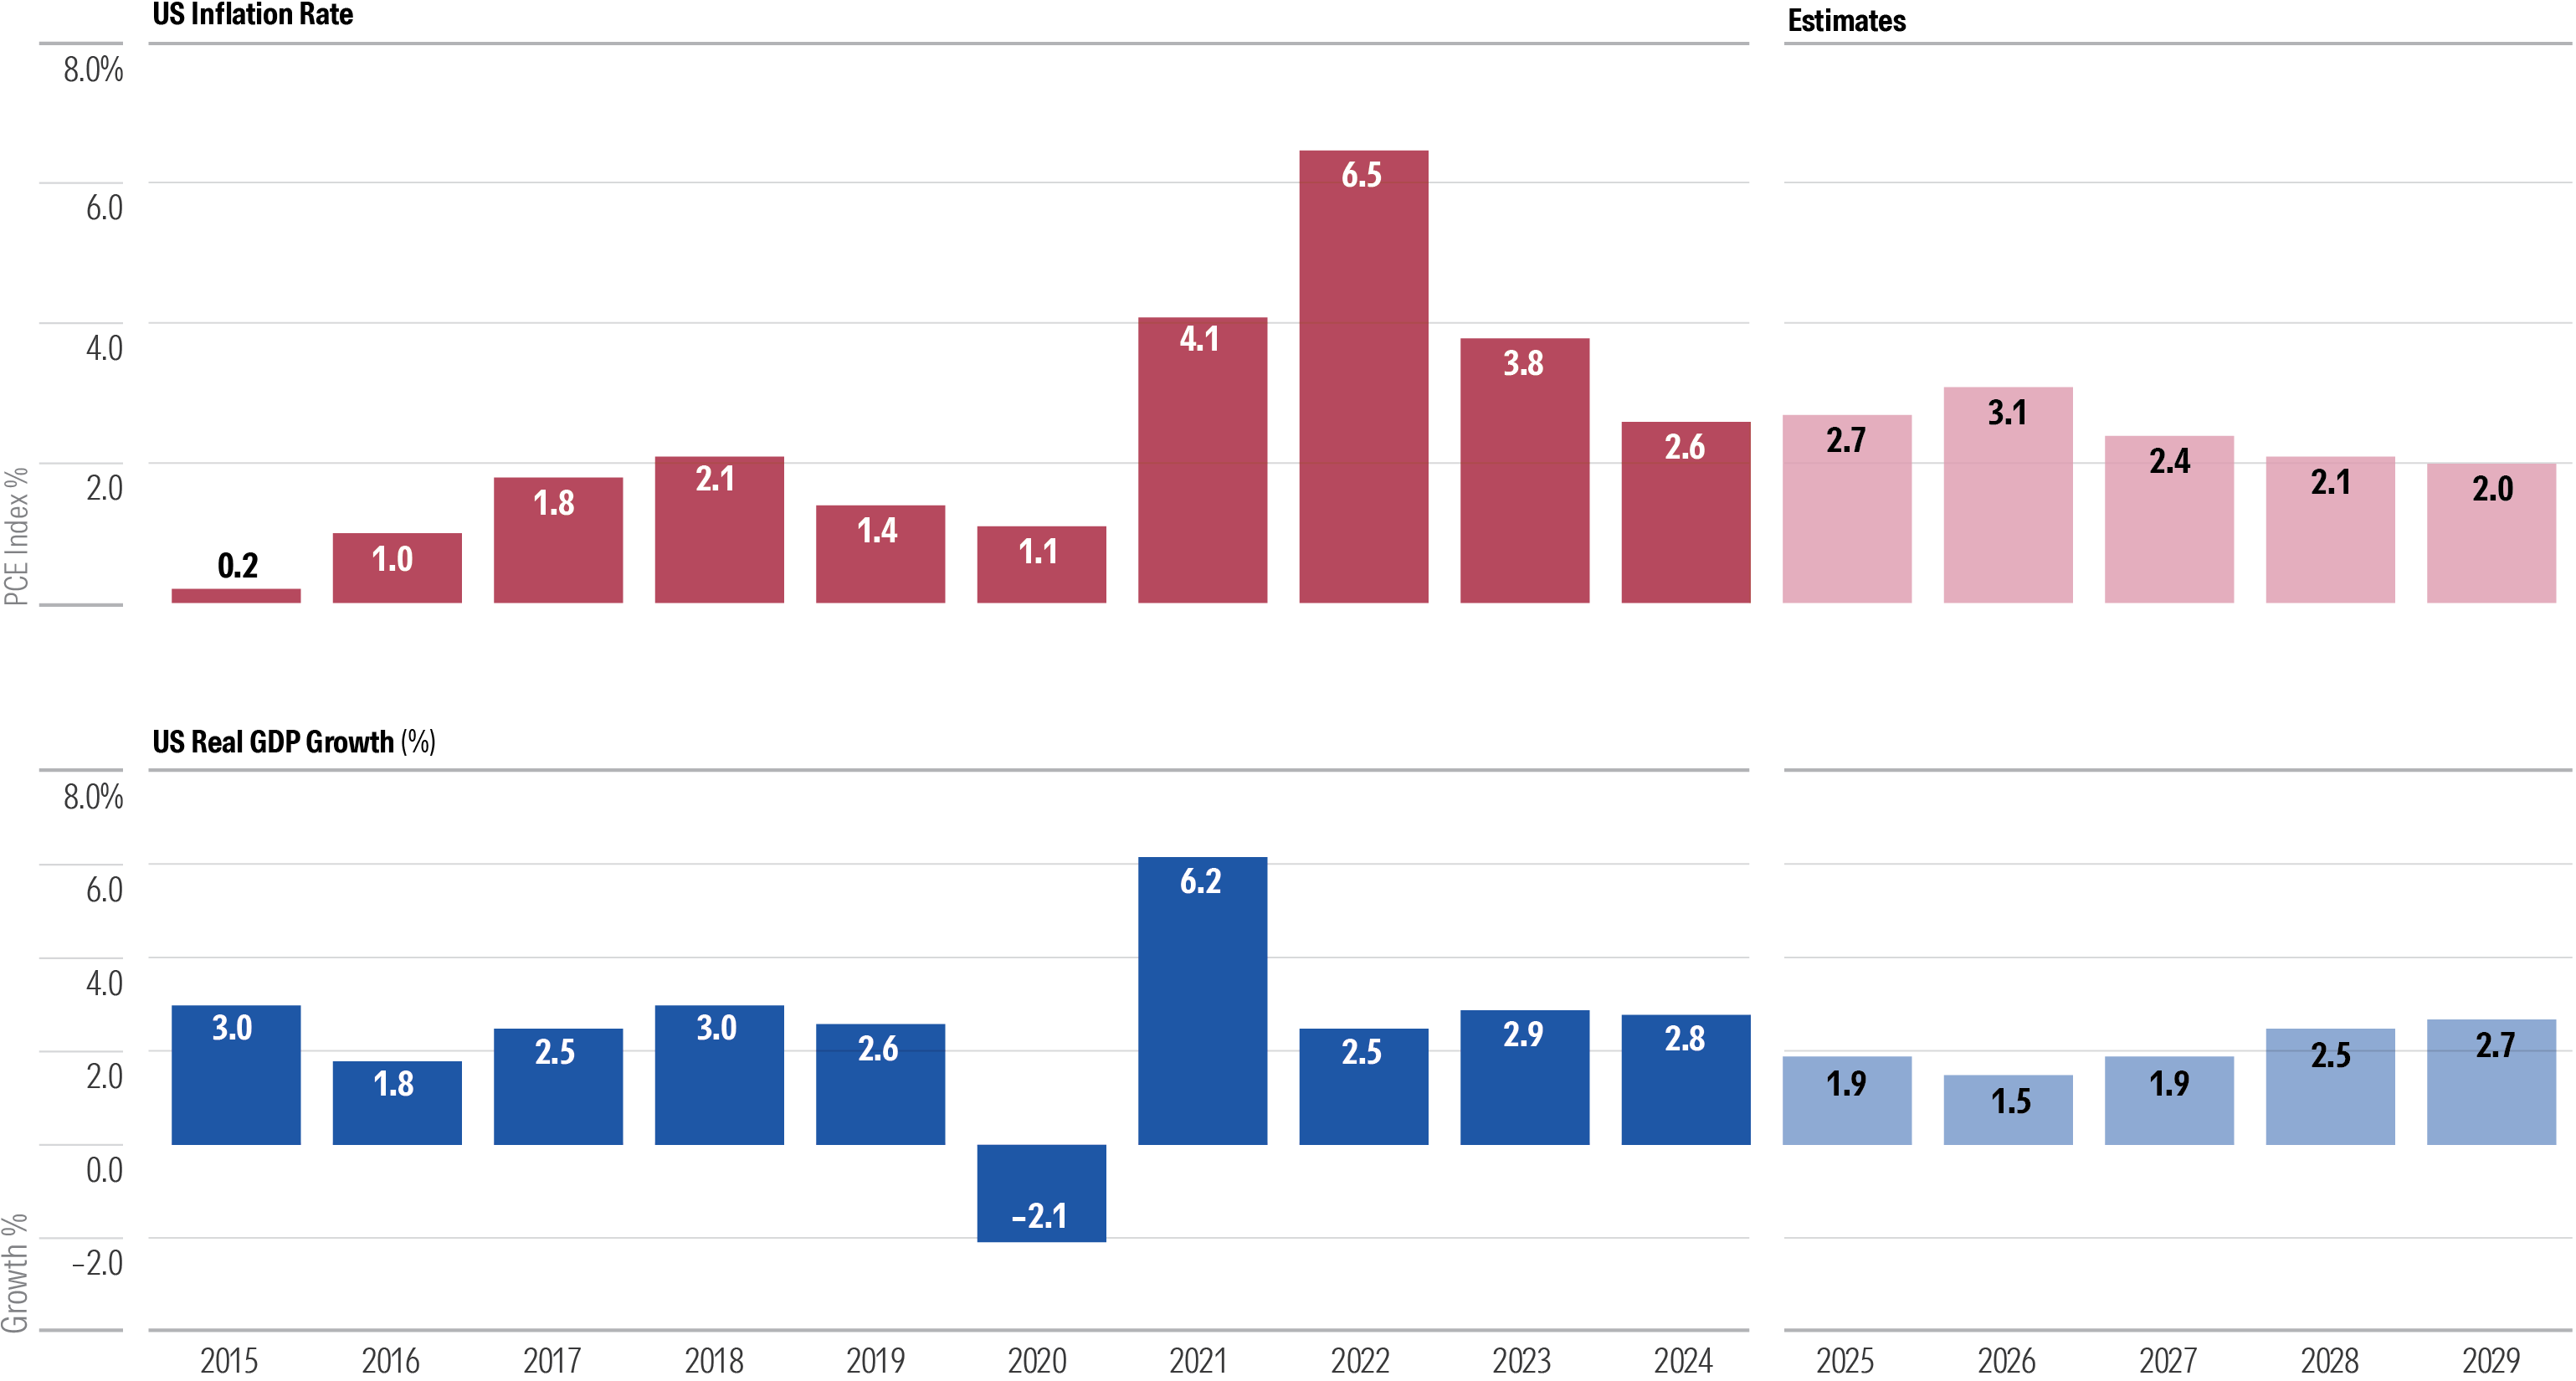
Will AI spending spur productivity gains and GDP growth, or eliminate jobs and trigger a recession? The optimistic narrative has won out so far. US GDP growth remains strong, but inflation is also trending above the Federal Reserve’s 2% annual target.
US GDP and Inflation Expectations
Positive Sentiment Is Driving Global Stocks Higher
AI optimism has fueled US large-cap stocks so far this year, but international stocks have done even better. As the chart below shows, several markets throughout Latin America, Europe, and Asia have delivered strong gains.
Global Market Barometer
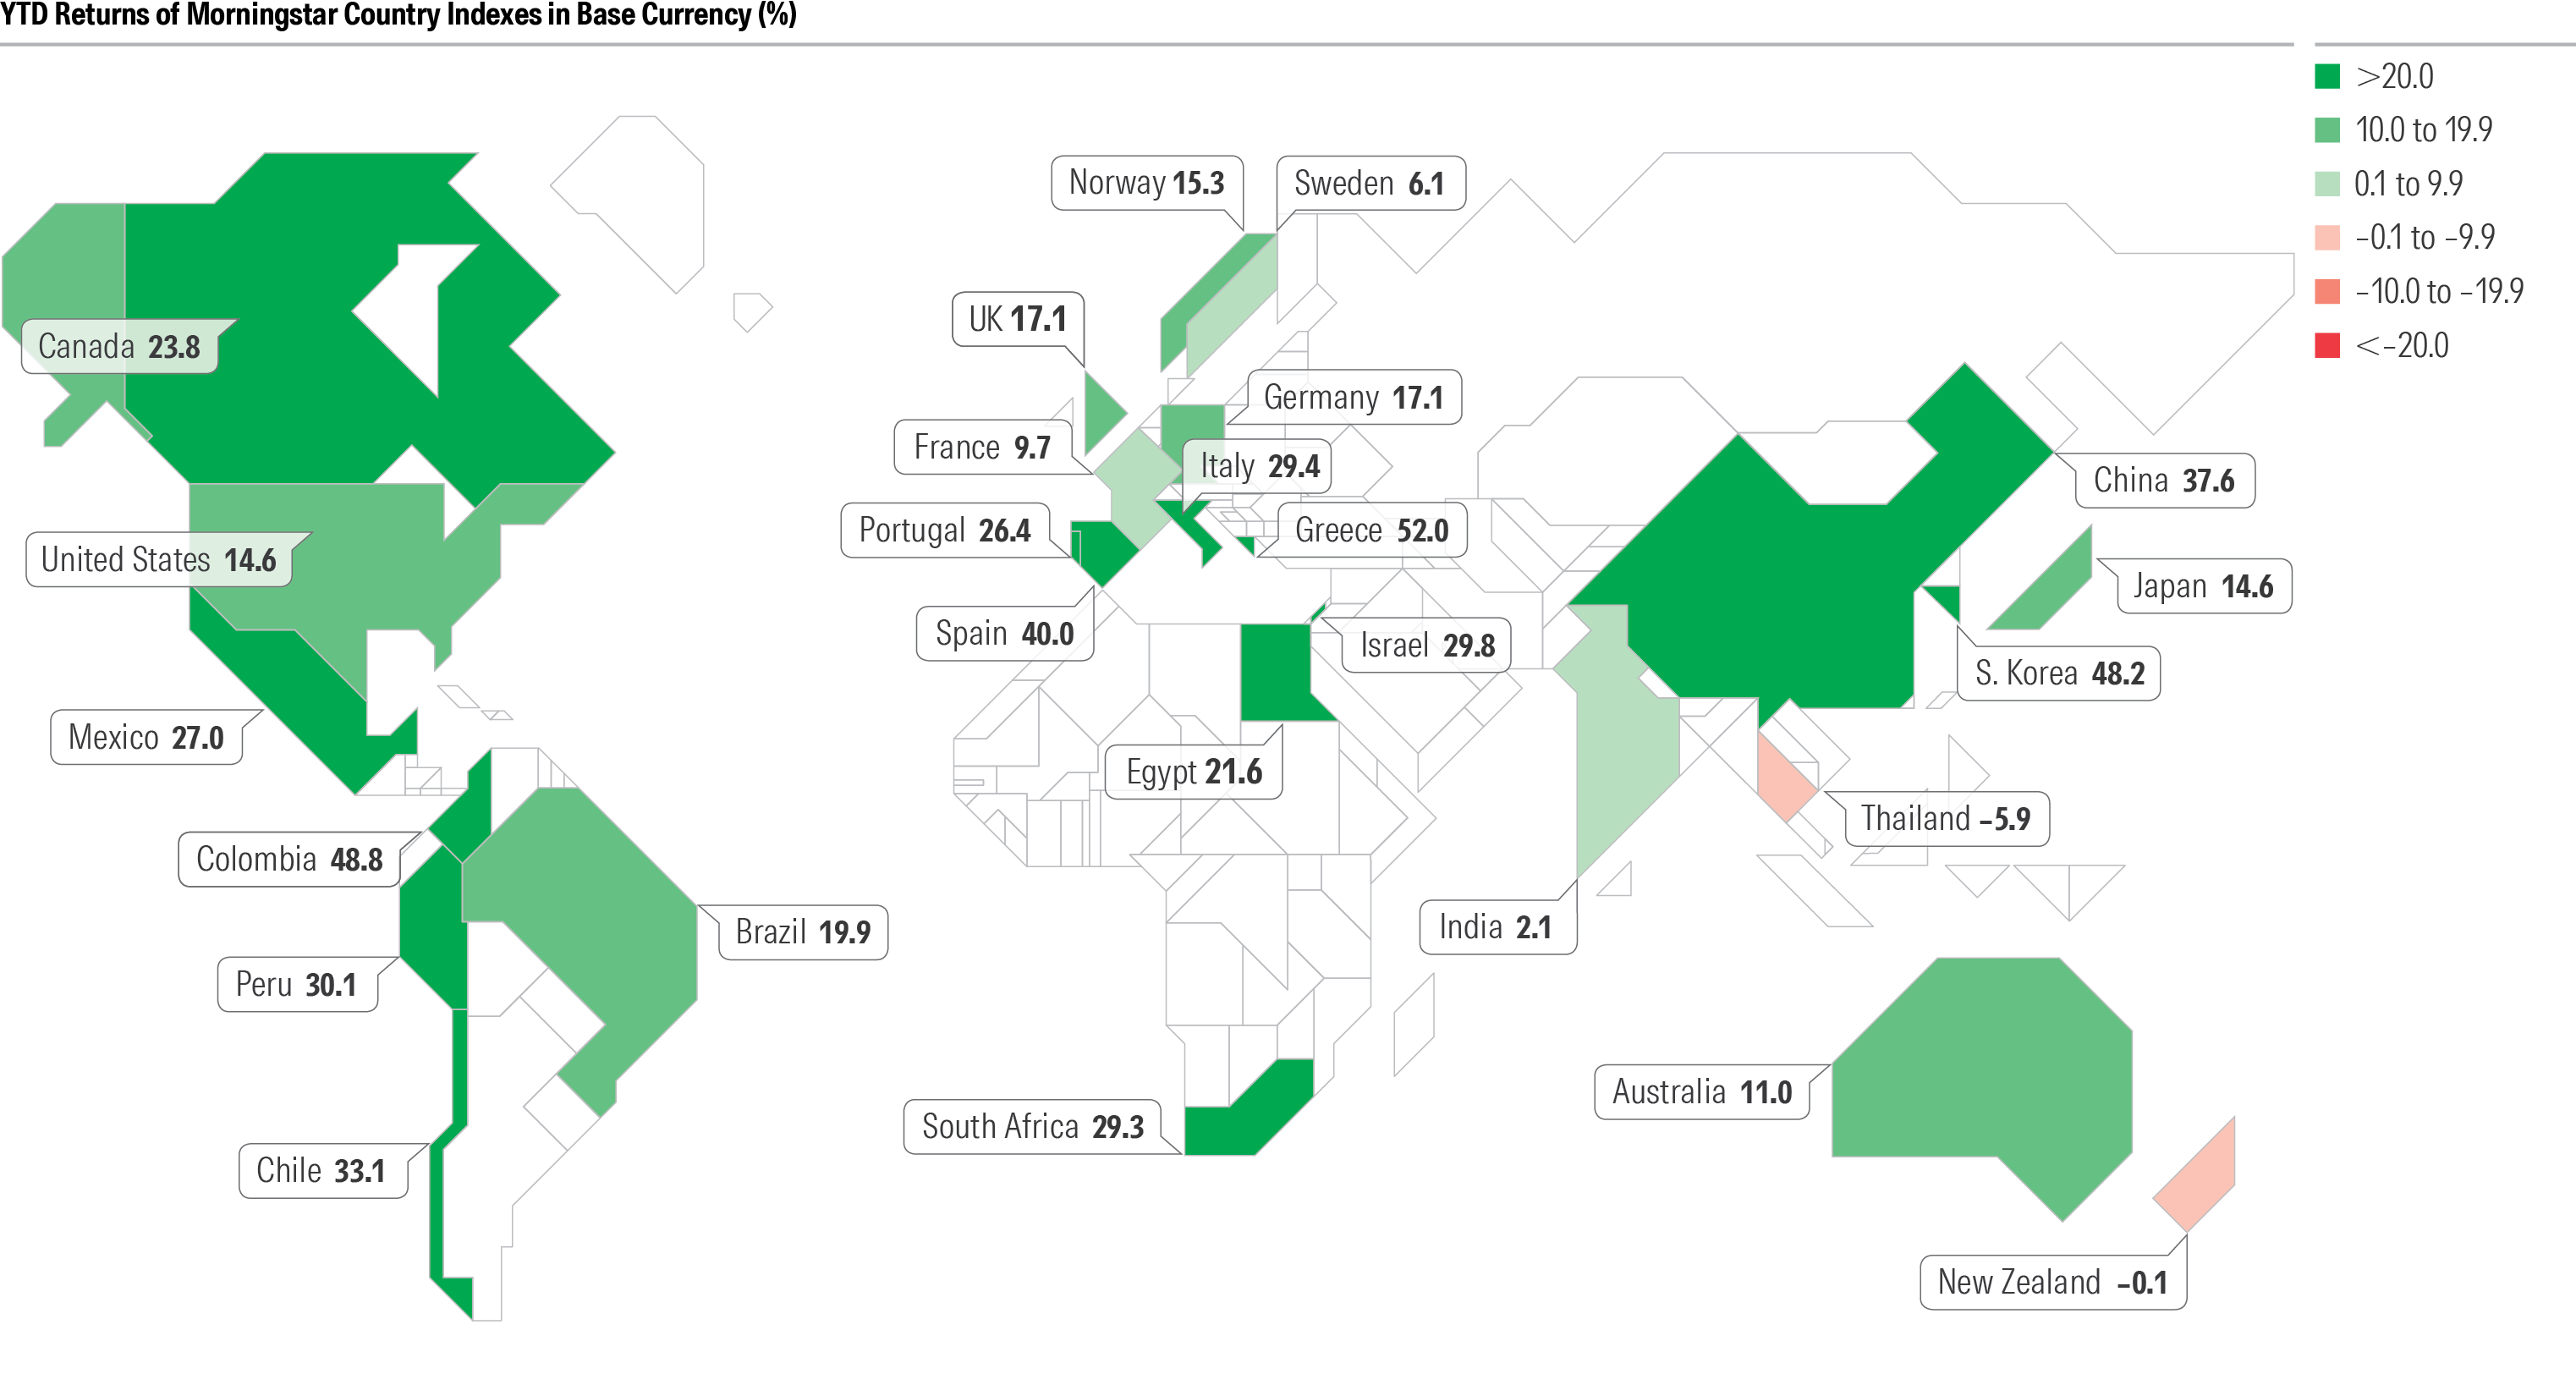
International markets started the year trading at much lower valuations than the US, and at least so far have shrugged off America’s protectionist policies and rhetoric. Local and regional AI investment, coupled with initiatives to revive consumer and defense spending, cut interest rates, or improve market function have helped many foreign stock markets to record highs in 2025.
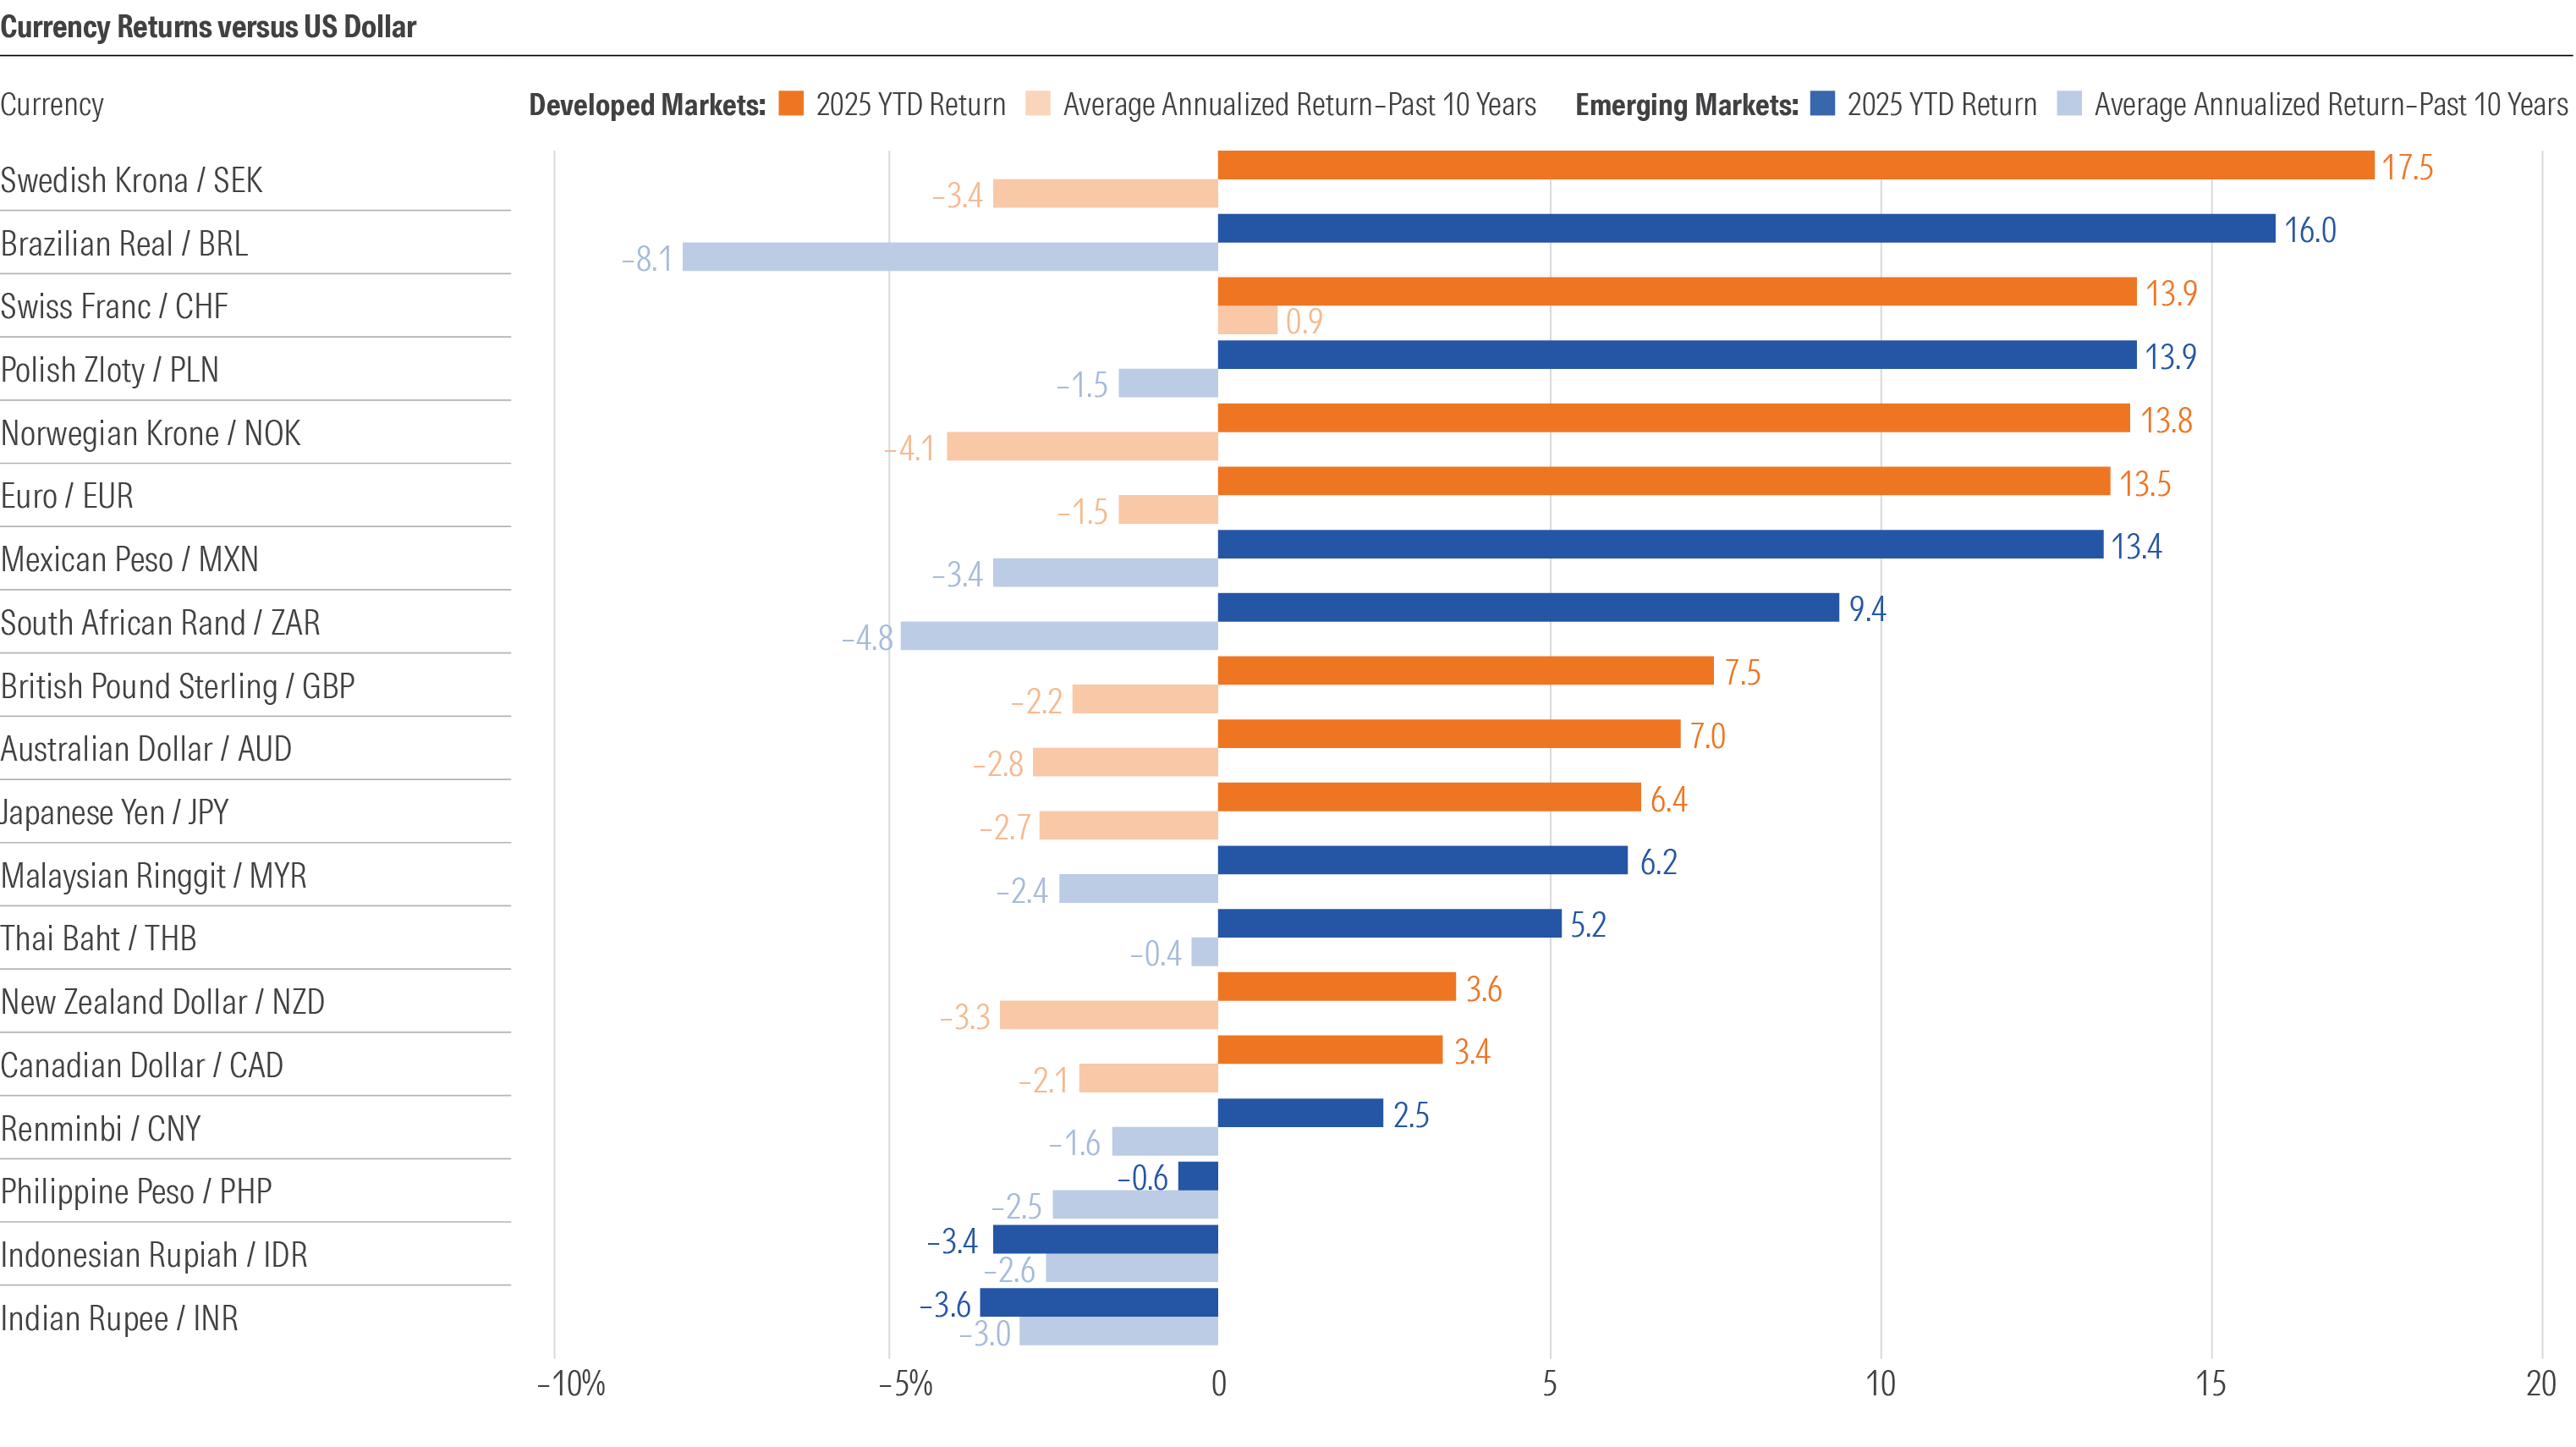
US dollar weakness, which boosts returns of non-US assets, further fueled their outperformance. The chart below shows that strong euro returns relative to the US dollar helped eurozone market returns.
A Weak US Dollar Helps Foreign Stock Returns
Negative Sentiment Is Driving Gold Higher
Despite this optimism, a frenzied gold rally suggests seeds of doubt.
It’s rare for stocks and gold to rise in unison because the latter is often considered a hedge for the former. But that’s exactly what’s happening this year. Gold outpaced many major stock indexes, reaching record highs seemingly every week. State Street’s popular gold ETF, SPDR Gold Shares GLD, returned a staggering 46% through the first nine months of 2025. Including October’s recent blip, it’s still up nearly 52% through October 27. The Morningstar US Market Index is up 17.8% for the same period.
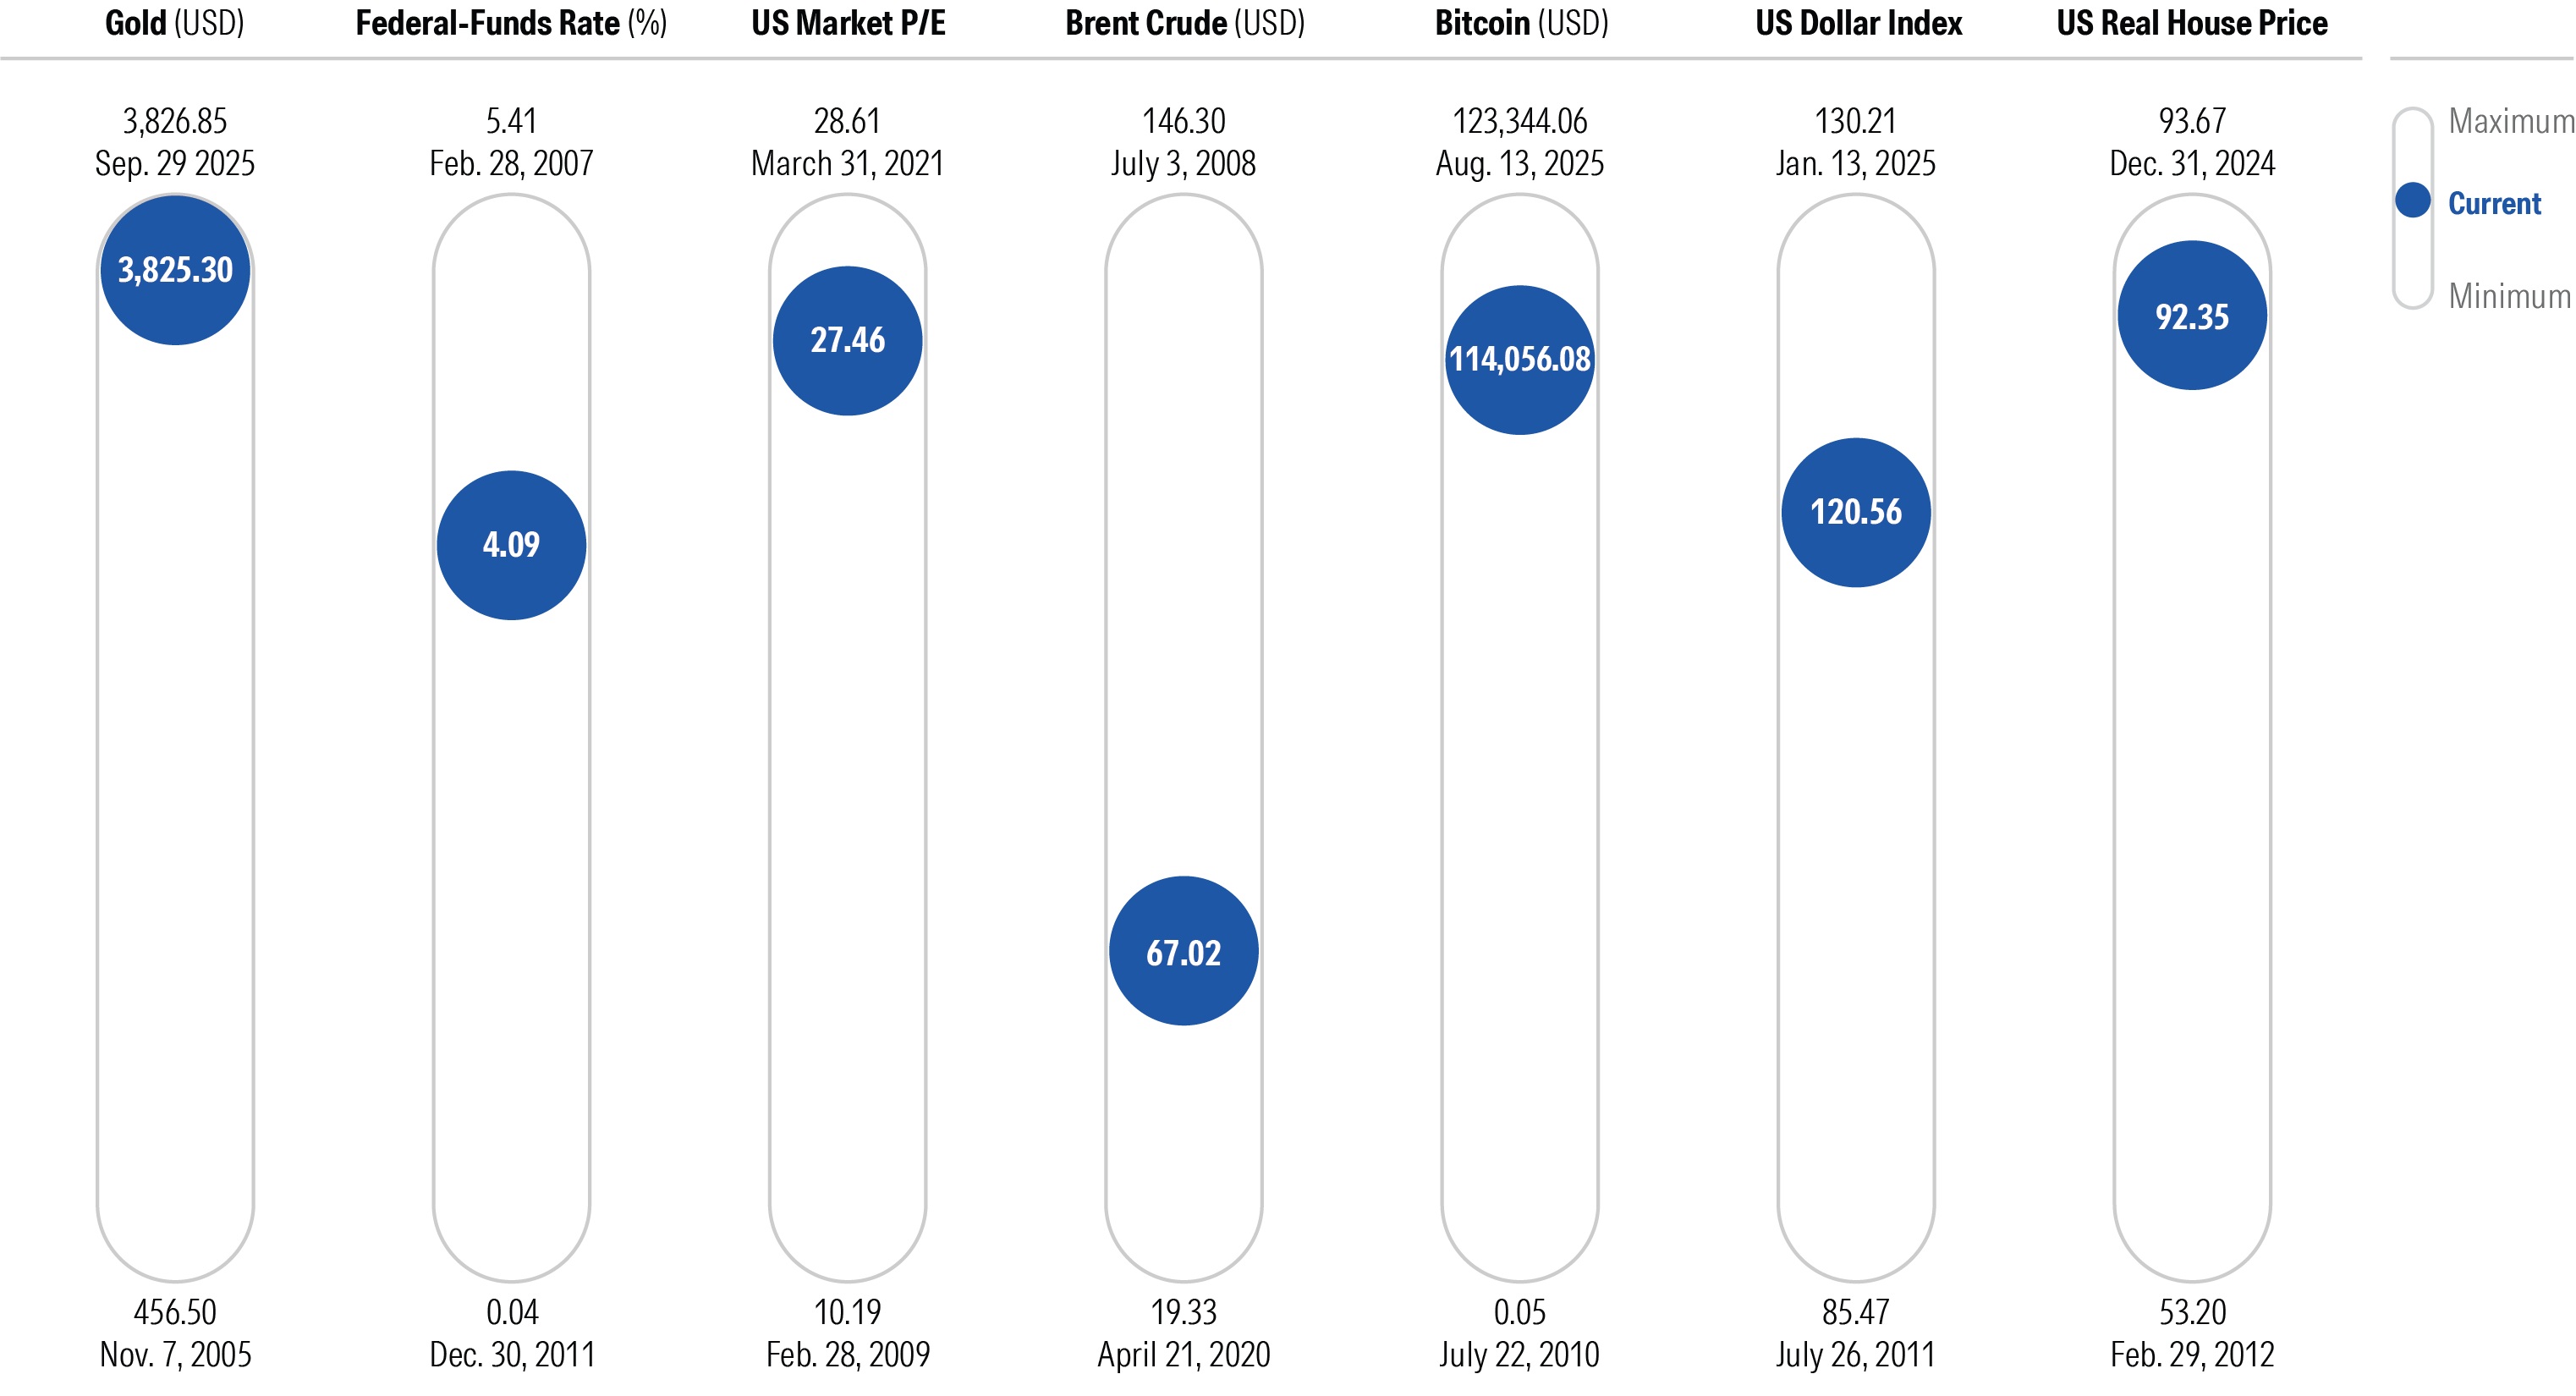
Even bitcoin is near record highs. Gold, bitcoin, US house prices, and US stock valuations are near their respective record highs of the last 20 years.
Market Thermometer
Looking Ahead
There is no shortage of competing narratives in the market today. Negative and positive sentiment will continue to be at odds, and it remains to be seen for how long both can support broad asset price growth.
All charts are derived from the Q4 2025 Morningstar Markets Observer. The report summarizes key market trends from the prior quarter and is authored by several members of Morningstar’s research teams. The full report can be accessed for free by clicking this link.
Preston Caldwell, Hong Cheng, Sbidag Demerjian, and Sean Murphy contributed to this article.
5 Stocks to Buy Before They Climb Higher
The author or authors do not own shares in any securities mentioned in this article. Find out about Morningstar’s editorial policies.

 United States