
How Bond Funds Performed in Q3 2026
Bond investors endured their toughest quarter of the year.


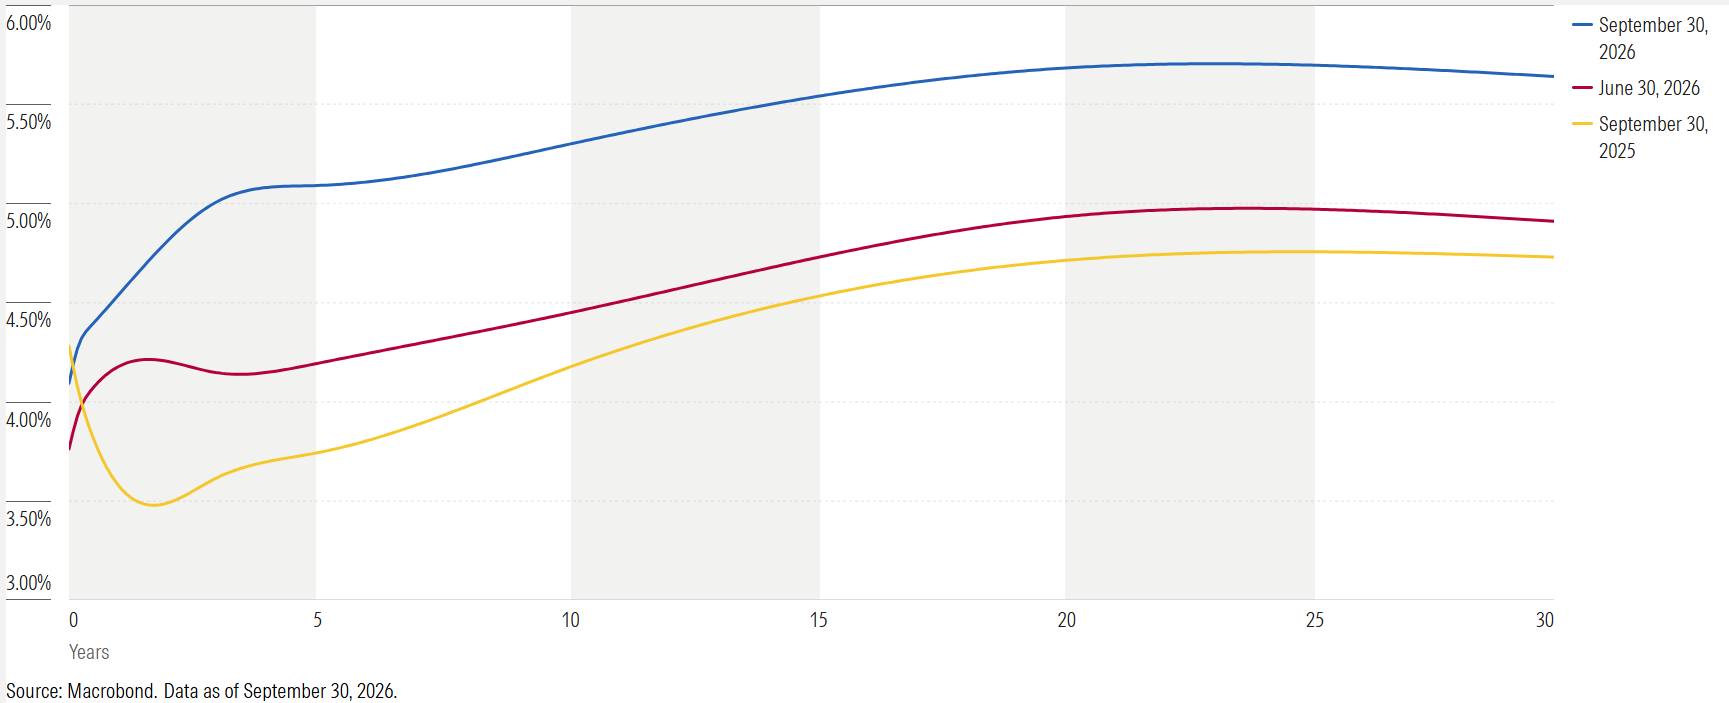
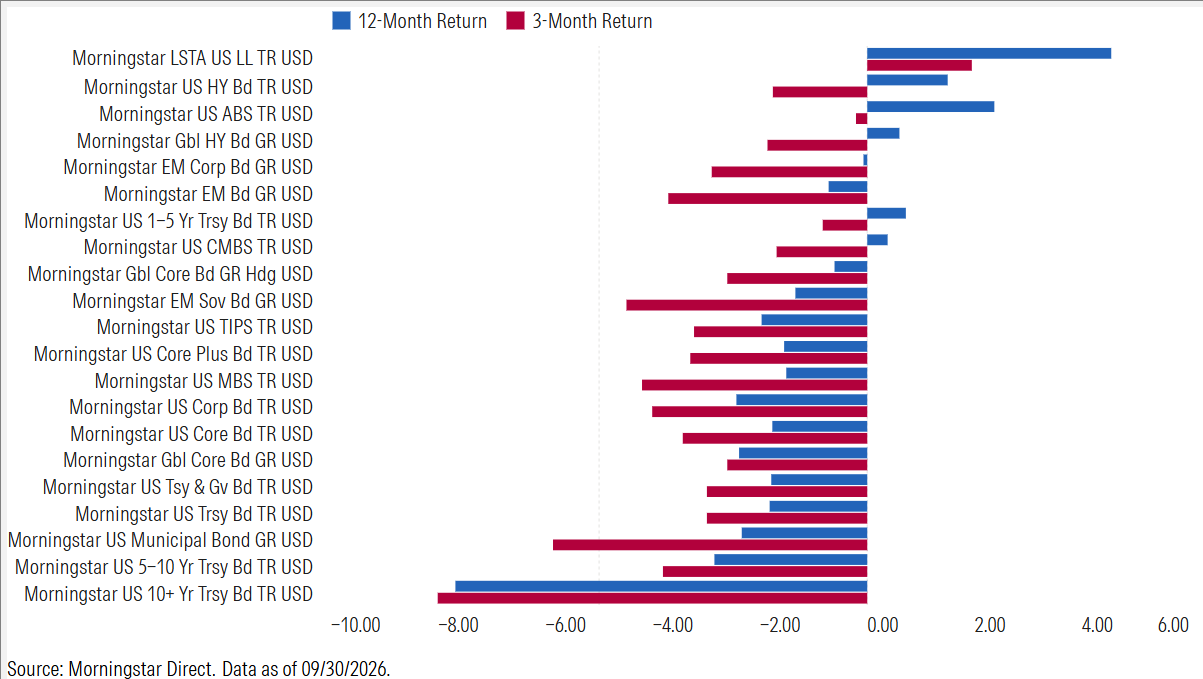
Fixed-income markets swooned in 2026’s third quarter as a surge in interest rates across the Treasury yield curve drove bond prices down. The Morningstar US Core Bond Index, a proxy for the US-dollar-denominated investment-grade bond market, shed 3.4%, its worst quarterly performance since 2022’s third quarter and its fourth-worst quarterly loss over the past 25 years. The market’s worries began in July with an escalation in the Iran war that sent oil prices sharply higher and revived inflation fears. Federal Reserve Chair Kevin Warsh’s resolve to combat inflation in a speech at Jackson Hole, Wyoming, in late August preceded the Fed’s first rate hike since 2023, a 25-basis-point increase on Sep. 16 that pushed the 10-year Treasury yield to about 5.3% by the end of September, up 85 basis points from the end of June.
Indexes with longer durations (a measure of interest rate sensitivity) showed how much it is possible to lose in bonds in a short period when rates rise. The Morningstar US 10+ Year Treasury Bond Index fell 8.0%, while the Morningstar US Municipal Bond Index declined 5.9%. Parts of the bond market that are driven by credit risk (a borrower’s willingness and ability to repay) and that had less interest rate sensitivity held up much better. The Morningstar US High Yield Bond Index lost 1.8% as its shorter duration and higher coupons softened the impact of rising yields. Leveraged loans performed the best because their floating-rate coupons reset higher as rates increase. The Morningstar LSTA US Leveraged Loan Index’s 2% gain represented the only major bond sector to finish the quarter in the black.
US Treasury Yield Curve Change
Morningstar Index Returns
Let’s look more closely at several fixed-income categories and how some bond managers navigated the quarter.
Municipal Bonds Sold Off
After a strong first half, a mix of rising interest rates and too much supply led municipal bonds to sell off more sharply than every major fixed-income sector except long-term Treasuries. The muni selloff created relative value opportunities as muni-to-Treasury ratios, which gauge the relative cheapness of munis versus Treasuries of similar maturities, widened across the yield curve: The ratio for maturities under three years, for example, moved to 75% from roughly 60%.
Muni funds with shorter duration profiles held up better in this environment. Baird Core Intermediate Municipal Bond BMNIX, which has a Morningstar Medalist Rating of Gold, lost 4.2% but outpaced most of its national intermediate muni Morningstar Category peers, which lost 5.3% on average. The Baird managers anchor their core intermediate strategy’s interest rate sensitivity to the Bloomberg 1–15 Year Municipal Index, which keeps its duration shorter than many rivals. That positioning cushioned the impact of the quarter’s rate surge.
Gold-rated Vanguard Intermediate-Term Tax-Exempt VWIUX lost 5.1% but still beat more than half of its national intermediate muni category peers. Its investment-grade focus helped limit losses during the selloff, even as the broader muni market absorbed heavy supply alongside rising yields.
Long-Duration Bonds Took the Hardest Hit
Long-duration strategies suffered the most. With the 30-year Treasury yield climbing above 5.6%, the typical long-term bond category fund lost 6.9%. These funds carried an average duration of roughly 11.5 years, which translates into an 11.5% loss for a 100-basis-point rise in interest rates, all else equal.
Inflation worries kept Treasuries from serving as a safe-haven asset. Treasuries with five- to 10-year maturities index lost 3.8%.
Silver-rated Pimco Long Duration Total Return PLRIX lost 8.2%, trailing all of its long-term bond peers. The fund tracks the Bloomberg US Long Government/Credit Index, whose roughly 14-year duration made it especially vulnerable to rising yields. The managers generally keep duration and overall risk close to its index while seeking additional returns through sector positioning, security selection, and modest off-benchmark exposure.
Floating-Rate Strategies Led the Bond Market
Leveraged loan strategies once again showed their value in a rising rate environment. Gold-rated T. Rowe Price Floating Rate PRFRX also posted a solid return. The team relied on its bottom-up credit selection and concentrated the portfolio in its highest-conviction BB and B rated loans, with an emphasis on borrowers whose credit profiles were improving. This selective approach helped the fund benefit from higher floating-rate coupons while managing the additional credit risk that comes with lower-rated loans. The fund’s 1.7% gain for the quarter outpaced the bank-loan category’s median 1.6% return.
Bronze-rated Janus Henderson AAA CLO ETF JAAA rose 1.2% for the quarter. The ETF invests in floating-rate, AAA rated collateralized loan obligations, so its minimal interest rate sensitivity and low credit risk helped it make money amid a losing quarter for most.
The author or authors do not own shares in any securities mentioned in this article. Find out about Morningstar’s editorial policies.

 United States