
US Fund Flows: Recovery Continues in June After April Miss
Bond, crypto, and international-stock funds flourished, but investors weren’t buying the US stock rally.




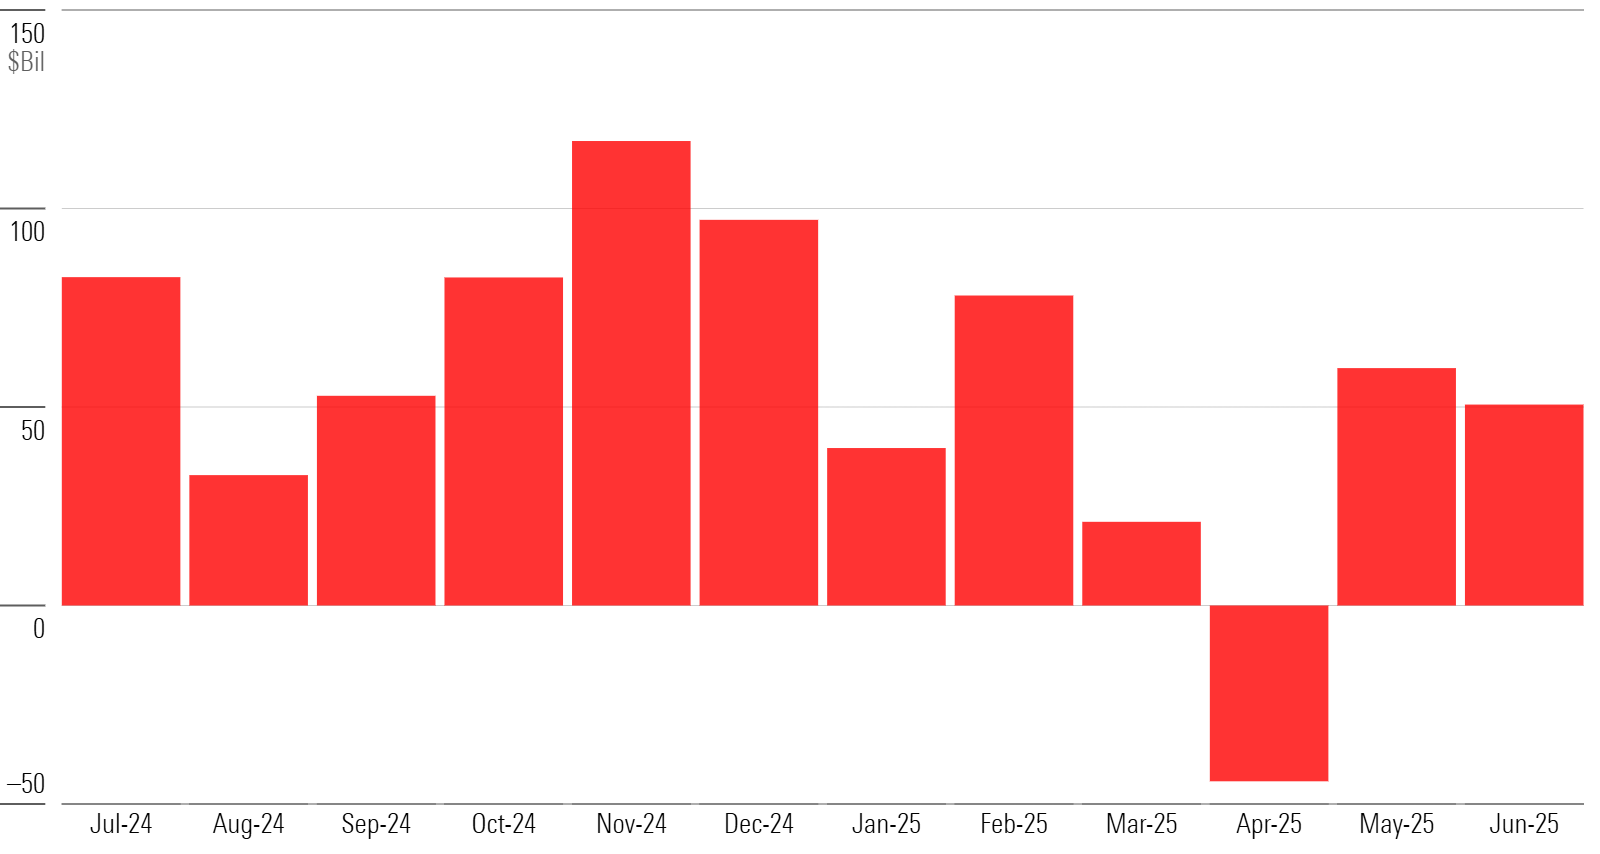
As markets continued to rally in June, investors put about $50 billion to work in US open-end funds and exchange-traded funds. But not all asset classes benefited: While bond funds generally saw inflows, US-stock fund flows suffered despite the continuing rally in US stocks that has pushed benchmark indexes like the S&P 500 and Nasdaq composite to new record-highs. Investors continued to add to precious-metals and digital-assets funds. Taxable-bond funds are the big winners, though, accounting for 92% of the $204 billion that has entered long-term mutual funds and ETFs so far this year.
US Long-Term Funds Monthly Flows
Bond-Fund Flows Dominated by Intermediate Core Bond
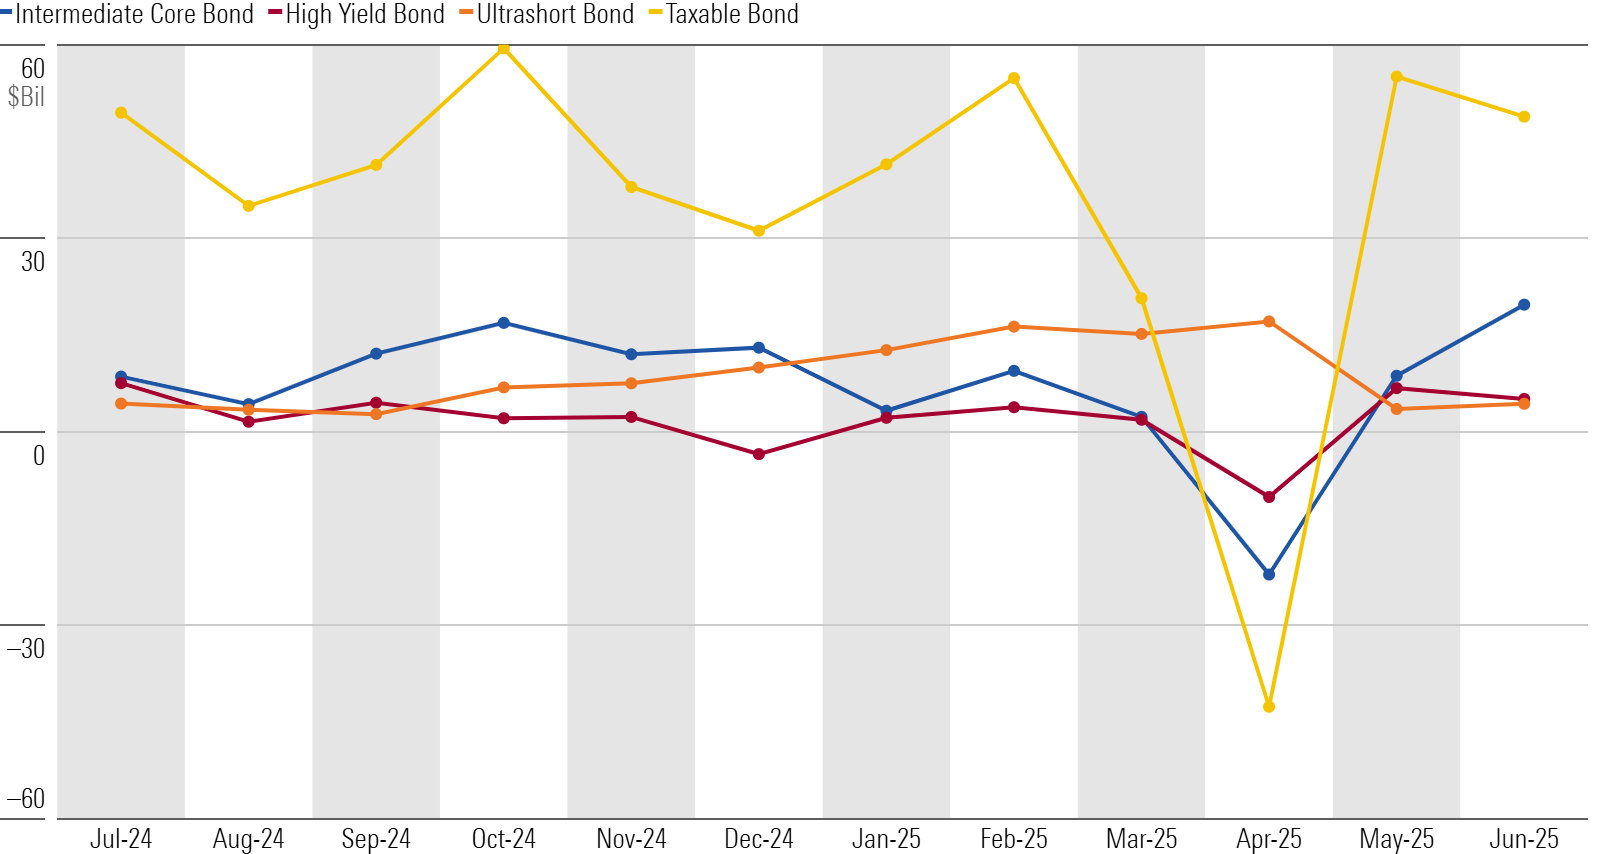
Bond funds gained $48.8 billion in June, with all but three of the 23 taxable-bond Morningstar Categories in the black. Intermediate core bond funds topped the list with $19.7 billion of inflows—the most since June 2021. At the bottom of the list were long-term bond and long government funds, which each saw about $1.3 billion in outflows during the month. Outflows have hit long-term bond funds in seven of the past eight months, and four of the past eight for long government, suggesting some investor wariness around inflation and deficit spending.
Taxable-Bond Fund Flows
Outflows Continue in US Stock Funds
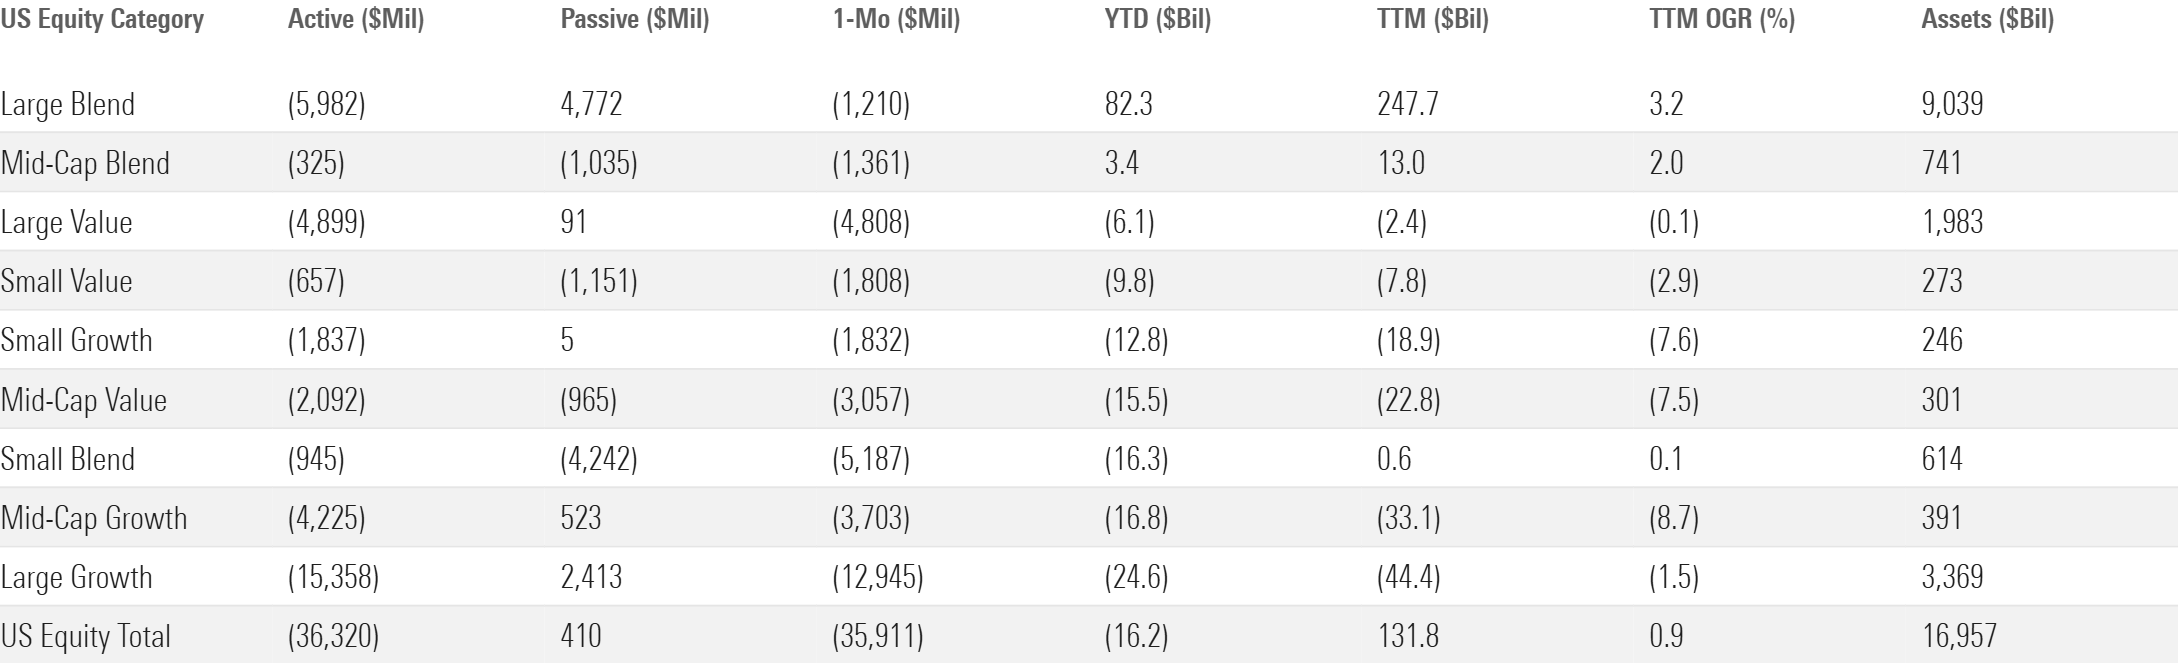
Even as US stocks continued to rally in June, US equity funds suffered outflows for the second month in a row, with all of the group’s categories in the red. The large-growth segment, the only one with inflows in May, bled nearly $13 billion in June. Muted inflows meant passive strategies didn’t bail out these categories as they often have in the past. The only gainers in the year’s first half were large-blend and mid-blend, with the US equity group overall losing $16.2 billion. Still, over the past year, investors pushed more than $207 billion into S&P 500 trackers, driving inflows into large-blend and supporting the cohort overall.
US Equity Category Flows
Investors Double Down on International Equities
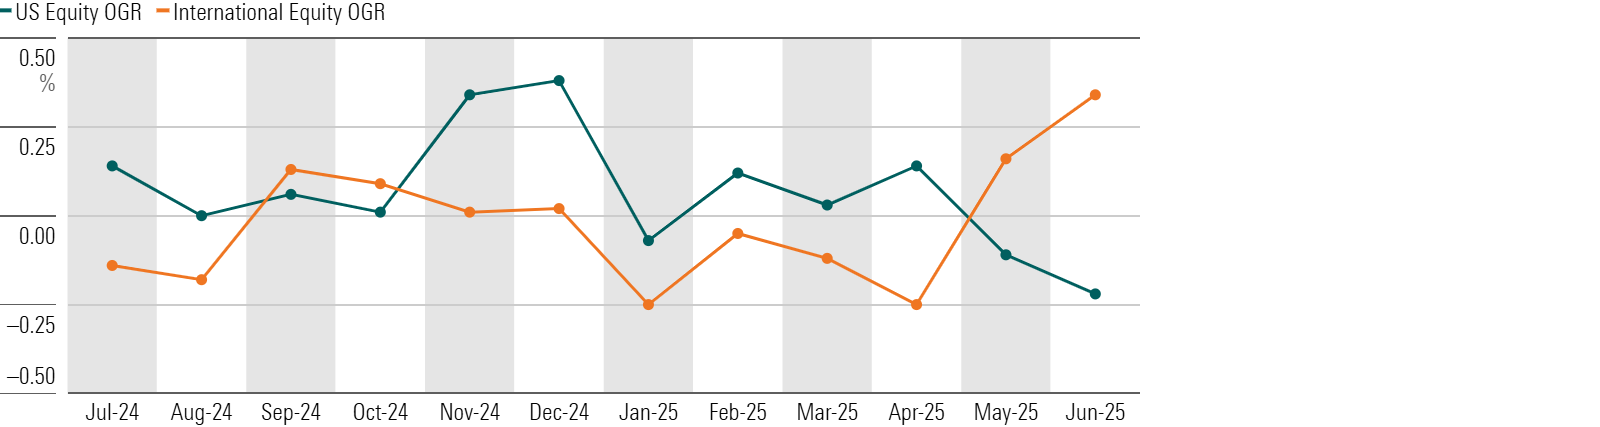
International-equity funds built on their strong May momentum, with inflows accelerating to over $15 billion in June, highlighting investors’ continued appetite for global diversification amid lingering macro uncertainty. In the meantime, US equity funds extended their outflow streak, shedding $35.9 billion in assets—their most severe monthly loss in over three years.
International Fund Flows
Technology Leads Sector-Equity Turnaround in June
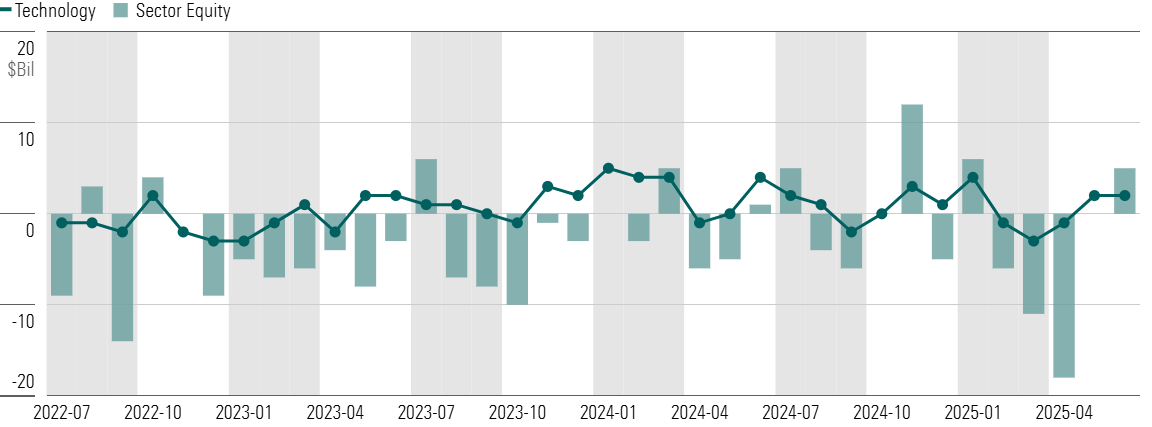
Sector-equity funds rebounded in June, pulling in $5 billion in assets after a few months of struggling and a flat May. Technology once again led the way with $1.9 billion in inflows, representing 38% of the total sector-equity fund flows. Given the technology sector’s large size, the organic growth was a modest 0.4% for the month. A few sectors have experienced meaningful changes in investor demand this year; utilities and industrials posted strong positive organic growth rates of 6.2% and 4.8%, respectively, while energy equity funds shrank 13.2%, and precious-metals funds dropped 10.8%.
Sector Equity Fund Flows
Active ETFs’ Rapid Ascent Slows Slightly
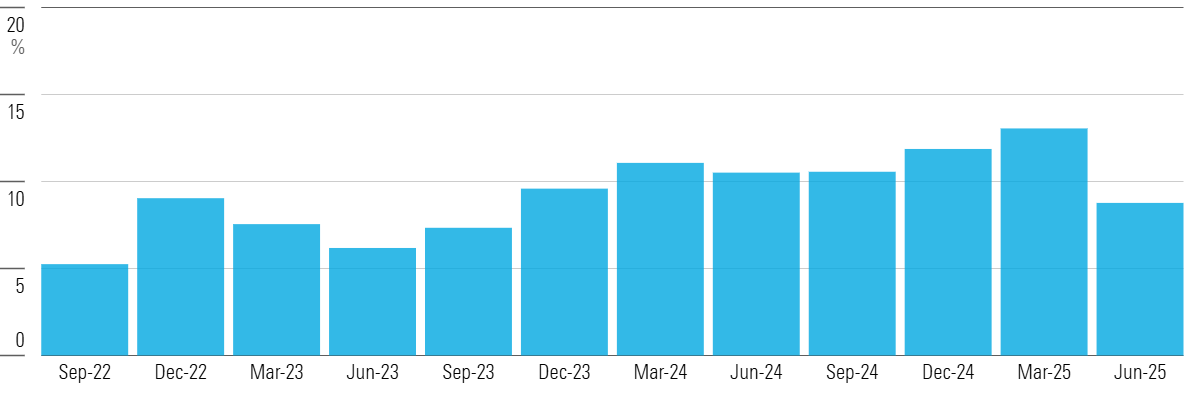
Active ETFs are hot these days, but June was relatively cool. Inflows of $29.4 billion in June brought the first-half total to about $200 billion, representing an organic growth rate of 53.5%. That was slightly lower than the three-year median, however, and the 8.8% organic growth rate in 2025’s second quarter was the lowest since the third quarter of 2023. But some slower growth rates are likely, given ETFs’ increasingly large total asset base. Some categories of fast growth include derivative income, large value, large blend, and intermediate core bond.
Active ETF Monthly Flows
This article is adapted from the Morningstar Direct US Asset Flows Commentary for June 2025. Download the full report here.
The author or authors do not own shares in any securities mentioned in this article. Find out about Morningstar’s editorial policies.

 United States