
What Stock Analysts and Investors Are Getting Wrong About the Market
The market consistently overestimates the persistence of company’s ability to grow.


The expected rate of growth in future cash flows plays a pivotal role in investment analysis and valuations—the faster rate of growth in cash flows results in higher price/earnings ratios for growth stocks versus value stocks. In an October 2022 article, I showed that while growth stocks have produced higher returns on assets and equities and faster growth in earnings than value stocks, value stocks have provided higher returns. The risk-based explanation for why companies with inferior financial performance have outperformed is that value stocks are the stocks of riskier companies for which investors demand a premium. With that said, there is also a behavioral explanation with significant support from the academic literature, going back to as far as the 1960s: The errors persist (and, thus, are predictable).
Principle of Abnormal Profits
One of the fundamental principles of economics is that profitability is mean reverting. In a free-market, capitalist society when profits are “abnormally” high (far in excess of the average cost of capital), more capital gets allocated to that industry, product, or service. The result is that supply and competition increase, and profits revert to the mean (approach the average cost of capital). This eventually eliminates the abnormal profits. When profits are below normal, capital gets allocated away from that industry. Thus, supply and competition are reduced, and normal profitability is restored.
Despite the logic, there’s a large body of evidence that suggests that stock market analysts and investors alike ignore the principle that abnormal profits don’t persist for long. The result is that the market overestimates the ability of companies to persistently achieve an above-average growth rate of earnings. Overestimate earnings growth rates, and you overestimate returns.
What the Research Says About Persistence of Growth Rates
The first study on the persistence of abnormally high earnings growth rates was by Anthony Raynor and Ian Little. They sought to determine whether the fastest-growing companies tended to repeat their past performance in the future. Their book, Higgledy Piggledy Growth Again: An Investigation of the Predictability of Company Earnings and Dividends in the UK, 1951-1961, examined the performance of British companies over the period 1951–61. They ranked firms by their rates of growth in earnings per share and then formed them into growth groups: fastest, fast, slow, and slowest. The rankings were based on their performance for the period 1952–56. While there was a dramatic difference in the preformation period, there was virtually no difference in earnings growth rates among the four classifications in the postformation period. Even intra-industry, there was no persistence in earnings growth rates. The authors concluded, “Certainly investors are wrong to think that a few years’ above-average rise of earnings is evidence at all that good management, which will result in a continued rise, must be present.”
Eugene Fama and Kenneth French tested whether the theory of profitability reverting to the mean stood up to the historical data. Their study, ”Forecasting Profitability and Earnings,” examined the profits of an average of 2,304 US firms per year for the period 1964–95. The following is a summary of their key findings:
- There was a strong tendency for profits to revert to the mean.
- Reversion to the mean was strongest when profits were highest and lowest.
- Abnormally low earnings tended to revert even faster than abnormally high profits.
- Reversion to the mean occurred at a rate of about 40% per year.
- Real-world forecasts tend to underestimate the speed at which reversion to the mean in profitability occurs.
Louis Chan, Jason Karceski, and Josef Lakonishok, authors of the 2002 study, “The Level of Persistence of Growth Rates,” used a Compustat database of all domestic stocks for the period 1951–97. Their study covered 359 companies at the start and 6,825 at the end. The authors analyzed long-term growth rates in earnings using several different indicators of operating performance: operating income before depreciation, operating income before extraordinary items available for common equity, and net sales. Even with the acknowledged survivorship bias that produces an upward bias in the data (poorly performing companies often don’t survive and thus disappear from the database), they found that:
- While some firms have grown at high rates historically, they’re relatively rare instances—about what we would randomly expect.
- There was no persistence in long-term profit growth rates beyond chance, and there was low predictability even using a wide variety of predictor variables.
- Valuation ratios have little predictive ability in terms of future growth rates. They have little ability to differentiate between firms with high or low future growth rates.
- IBES earnings forecasts averaged 14.5%, 5.5% more than realized earnings growth.
- The overestimation problem was the worst for the most optimistic forecasts. The average five-year forecast for the top-quintile firms was for a growth rate of 22.4%, 12.9% greater than the average realized growth.
To demonstrate just how difficult a task it is to grow at 15% per year for a long time, they showed that only three of the nifty-fifty growth stocks of 1972 were able to grow at that rate or better over the next 25 years. And none grew faster than 18% per year. For the period from 1960 to 1980, just three companies were able to grow at 15% or greater (Standard Oil of Ohio, Philip Morris PM, and Boeing BA). For the period from 1970 to 1990, just four did so (Boeing, Philip Morris, Merck MRK, and PPG Industries PPG). And from 1980 to 1999, only five companies accomplished that goal (Fannie Mae FNMA, United Airlines UAL, Philip Morris, Merck, and Abbott Laboratories ABT).
They updated their study in August 2022 and found that while cases of very high growth had occurred, not only were they relatively rare, but there was scant persistence in growth beyond chance, and there is limited ability to identify firms with high future long-term growth. “IBES forecasts are too optimistic and have low predictive power for long-term growth.” They concluded, “Valuations that assume persistently high growth over prolonged periods rest on shaky foundations.”
In October 2022, Brian Chingono and Greg Obenshain of Verdad provided us with an update to the evidence on the persistence of growth rates. They began by citing evidence of the persistence of growth assumption: “The Vanguard US Growth Index consists of companies that have grown their earnings by 28% on average over the past five years. These growth stocks are priced at 29 times their trailing net earnings, a 52% premium to the overall US market’s 19 times price/earnings ratio. The average company in the US market portfolio has increased earnings by 20% annually over the past five years, an impressive number that seems to warrant similar discount rates between the overall market and growth stocks.”
To determine whether the same pattern of overestimating the persistence of growth existed out-of-sample, they examined all US stocks between 1997 and 2022. As shown in the table below, for all four measures of growth, they found little to no evidence of persistence in earnings growth, beyond chance, over the long term.
Persistence of Growth Rates (1997–2021)
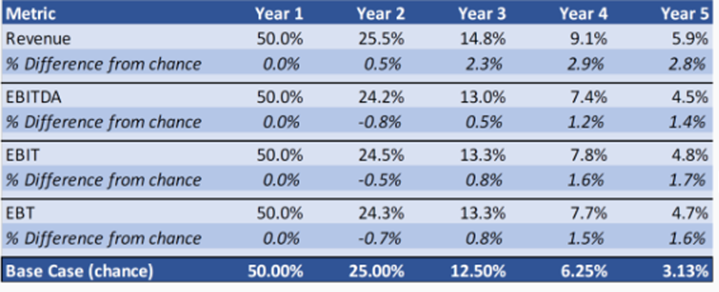
The above evidence suggests that the hypothesis—that secular changes in the economy over the past two decades have changed the conclusion that earnings growth is not persistent beyond chance over the long term—is false. In other words, it’s not different this time.
Chingono and Obenshain next asked, “What if we focus specifically on firms that have demonstrated the highest level of earnings growth in the past? Would the highest flyers of the past have a better chance of maintaining above-median growth in the future?” To answer that question, they adjusted their analysis by isolating firms that were in the top quartile of growth over the previous year. The table below presents the results.
Persistence Among Firms Starting in the Top Quartile (1997–2021)
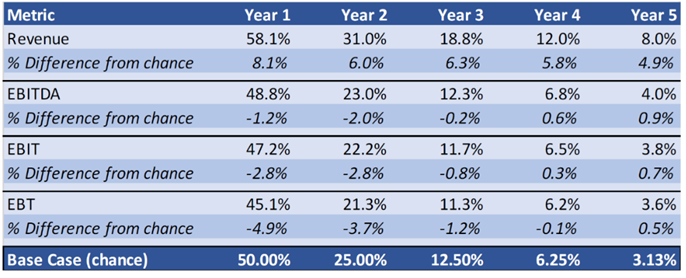
Because investors care most about cumulative growth rather than persistence of growth, Chingono and Obenshain also looked at cumulative growth over the next one to five years to determine whether past winners continued to outgrow the market median on a cumulative basis.
Cumulative EBITDA Persistence by Previous 1-Yr EBITDA Growth (1997–2021)
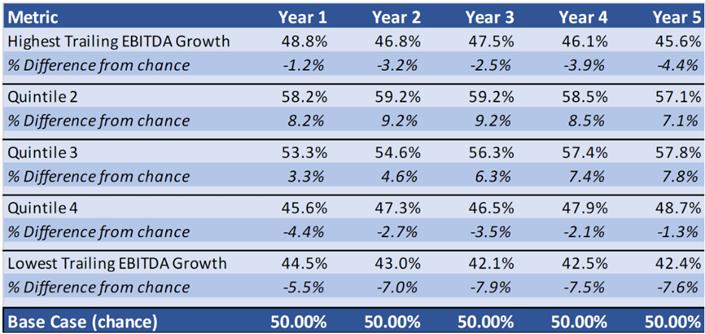
The outcomes for the highest trailing growth quintile are indistinguishable from the outcomes in the lowest trailing growth quintile. Past winners essentially had the same long-term outcomes as past losers in terms of cumulative earnings before interest, taxes, depreciation, and amortization growth.
A Preeminence of Forecast Errors
The empirical research we have reviewed demonstrates that for decades analysts and the market have overestimated the ability of companies to persistently generate abnormal growth in earnings. In a series of more recent papers (”Long Term Expectations and Aggregate Fluctuations,” 2023; ”Finance Without Excessive Risk,” 2024; and ”Belief Overreaction and Stock Market Puzzles,” 2024), the behavioral finance team of Pedro Bordalo, Nicola Gennaioli, Rafael La Porta, and Andrei Shleifer examined analyst forecasts of future earnings growth and compared actual results to historical expectations. They found that analysts’ forecasting errors and revisions explained “a large chunk” of factor returns and that the volatility of aggregate expectations can quantitatively explain Robert Shiller’s excess volatility puzzle. Their research showed that factors like value, investment, size, profitability, and momentum work because they predict surprises relative to expectations. “Average spreads materialize because the realized earnings growth of stocks in the portfolio’s short arm systematically disappoints compared with that of stocks in its long arm. The factors, therefore, aren’t proxies for exotic risk. They are proxies for nonrational beliefs about future growth.” For example, they found that the relative spread between the analyst forecasts for the long and short arms can predict the future returns of the factors: When analysts are extremely bullish about the growth rates on high-investment firms relative to low-investment firms, the investment factor will have abnormally high returns, and vice versa. They found that 60% of the variation in factor return spreads can be accounted for by expectations.
They concluded that the “preeminence of forecast errors” explains how the equity factors predict returns: “Analysts and the market appear to hold systematically bullish expectations about firms in the short portfolios, compared with firms in the long portfolios, and the former do worse on average because that relative optimism systematically decreases.”
Investor Takeaways
An implicit assumption in most forecasts is that growth is persistent. While analysts underwrite high growth for companies that have grown quickly and slow growth for companies that have grown slowly in the past, a large body of evidence demonstrates that reversion to the mean of both positive and negative abnormal earnings growth is the norm. The chances of finding the next Microsoft MSFT are about the same as the odds of winning the lottery because competitive pressures ultimately result in the dissipation of abnormal (both good and bad) earnings leading to reversion to the mean of profit growth.
A second conclusion could be that the persistent overestimation of the ability of growth companies to maintain high forecast growth rates is the cause of the historical long-term underperformance of growth stocks relative to value stocks.
A third is that the errors in forecasting persistence in earnings growth help explain Shiller’s excess volatility puzzle. (Stock prices fluctuate much more than can be justified by changes in underlying company fundamentals; market movements are often driven by factors other than anticipated future dividends or earnings.)
A fourth is that while future earnings growth rates and equity returns are unpredictable, Bordalo et al. demonstrated that there is “systematic predictability of forecast revisions and errors.” In other words, the analysts and market are predictably wrong. If that persistence continues, the errors in the estimation of future earnings growth are predictable.
The bottom line is that value stocks historically have outperformed growth stocks. If you think the explanation is risk-based, you should expect this outperformance to continue. If you think the explanation is behavioral-based, unless you expect investor behavior to change, you should expect value stocks to outperform as well.
The author or authors do not own shares in any securities mentioned in this article. Find out about Morningstar’s editorial policies.
Larry Swedroe is a freelance writer. The opinions expressed here are the author’s. Morningstar values diversity of thought and publishes a broad range of viewpoints.

 United States