
5 Charts on How Tariff Trouble Rocked US Fund Flows
Stock and bond funds suffered, while alternatives thrived.


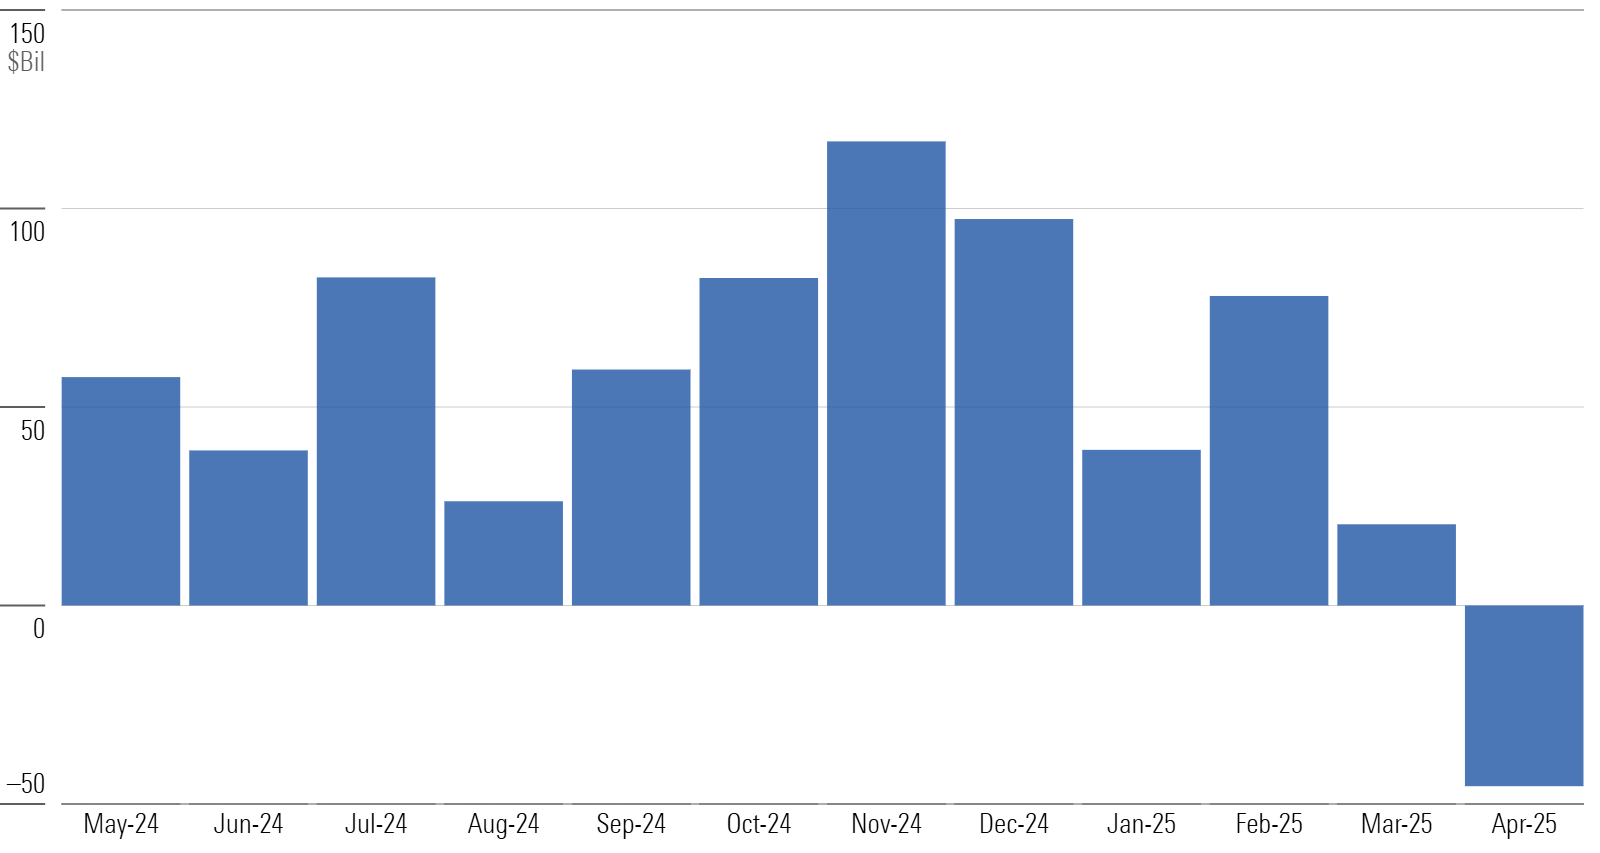
US President Donald Trump‘s announcement of a broad regime of tariffs on April 2, 2025, sent markets tumbling. Fund investors responded by pulling $46 billion from long-term US open-end funds and exchange-traded funds during the month. Five of the 10 category groups suffered outflows, with active strategies bearing the brunt of the exodus: They suffered $82 billion of outflows, while passive strategies took in $36 billion.
Long-Term US Flows
Bailing on Bonds
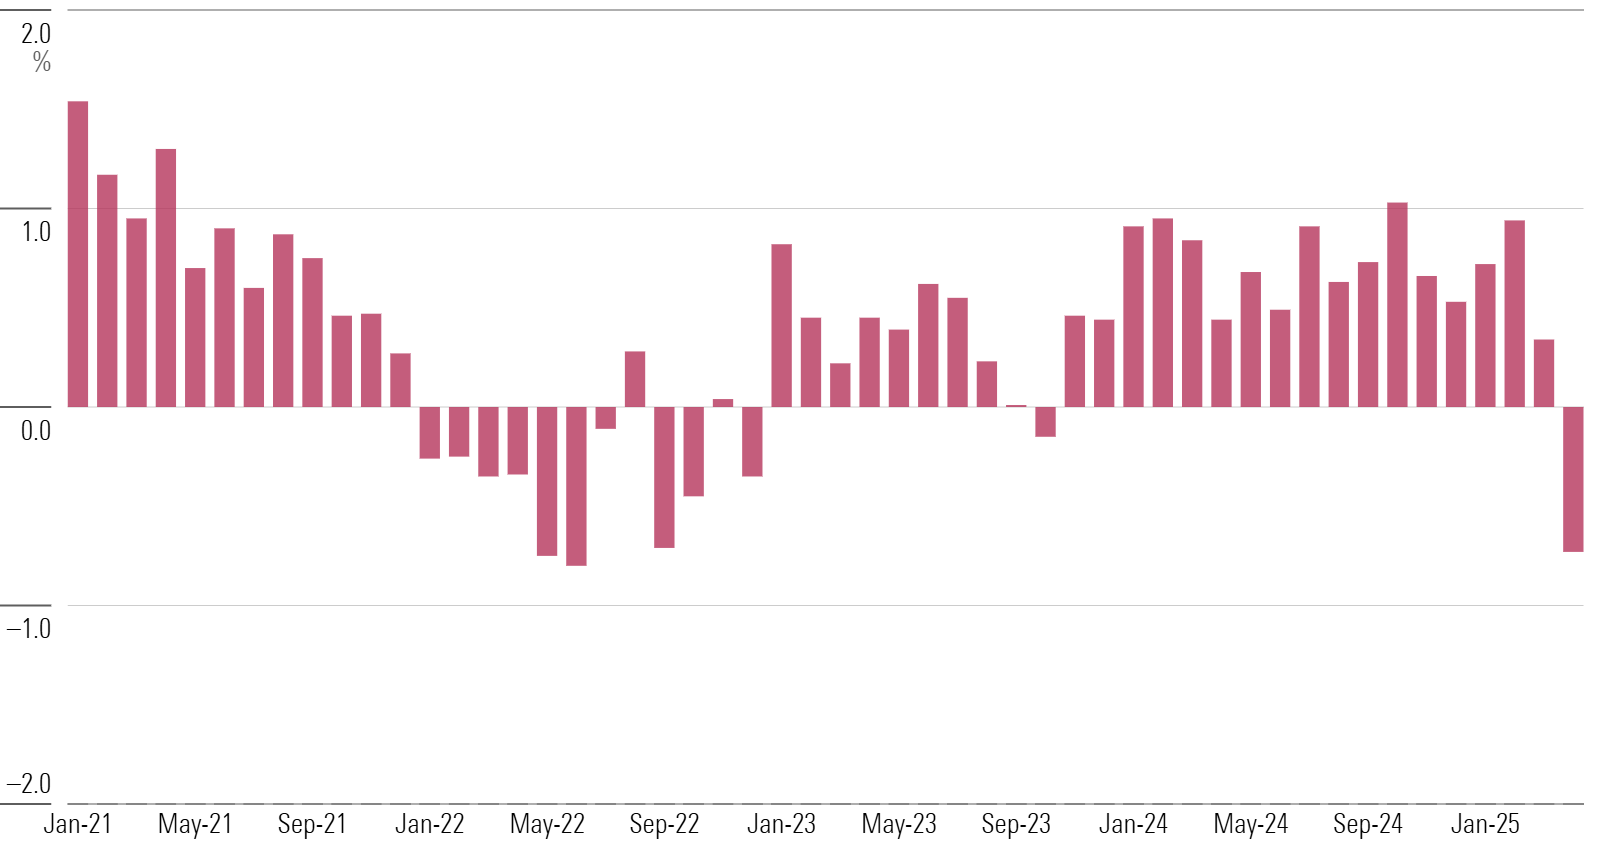
Bond-fund investors ran toward the exits at a rate last seen in 2022. Taxable-bond funds saw $43 billion leave in April, their largest outflow since March 2020 and equivalent to their worst monthly organic growth rate since June 2022. Intermediate-core bond funds were responsible for roughly half the outflows, though much of that came from rebalancing activity around a single large Vanguard fund.
Taxable-Bond Organic Growth Rates
Small-Cap Blend Investors Yank a Record Sum in April
Amid tumbling equity markets, most US equity Morningstar Categories suffered outflows. The main bright spot was the passive large-blend group, which often enjoys inflows regardless of the market. Small-blend funds had a rougher go. They endured a $6 billion outflow, their most ever and equivalent to 1% of their assets at the end of March—the category’s worst organic growth rate since 2017. Small-growth and mid-cap value funds similarly posted organic growth rates that ranked among the worst over the past 15 years.
US Equity Category Flows
Rising Tensions With China Help Drive Outflows From International-Equity Funds
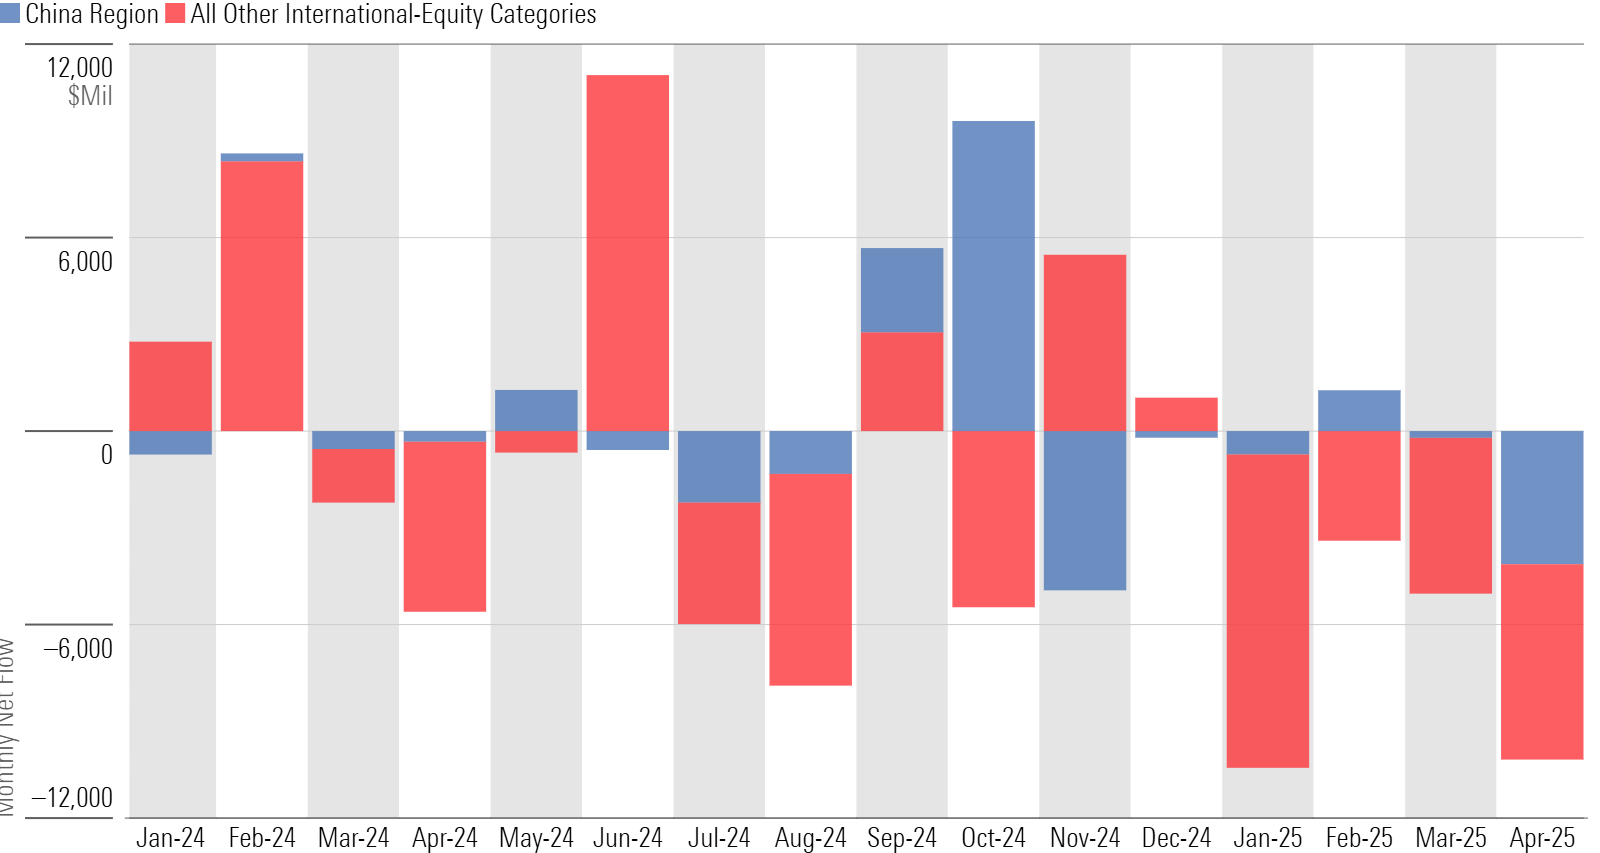
International-equity funds saw $10 billion leave in April. Most categories within the group suffered outflows, but none compared with the $4.1 billion outflow from China region funds. With the Trump administration labeling China as its top tariff target, funds such as KraneShares CSI China Internet ETF KWEB and iShares China Large-Cap ETF FXI had billion-dollar-plus outflows. The category suffered its third-worst monthly organic growth rate ever in April, notably right behind that of November 2024.
International-Equity Flows
Diversifying Funds Stood Out in April
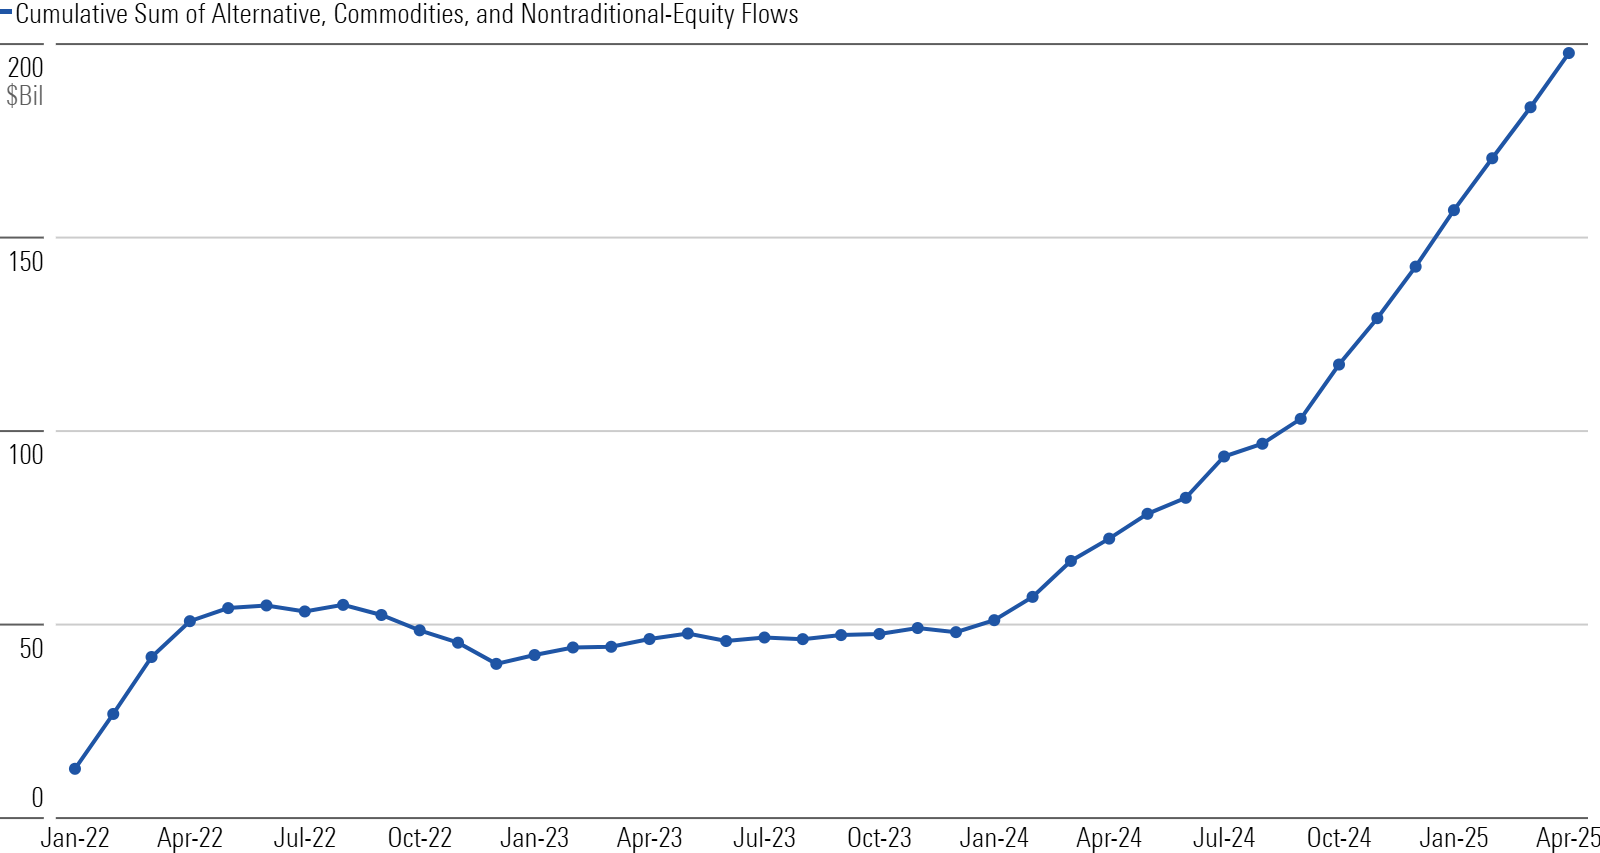
Amid broader concerns across the equity and fixed-income markets, funds offering differentiated risk characteristics fared well. Alternative funds took in $3.6 billion (mostly driven by flows into digital-assets funds); commodities funds gathered $5.0 billion (mostly driven by flows into gold ETFs); and nontraditional-equity funds enjoyed their usual inflows to covered-call and defined-outcome products.
Diversifying-Fund Flows
This article is adapted from the Morningstar Direct US Asset Flows Commentary for April 2025. Download the full report here.
The author or authors do not own shares in any securities mentioned in this article. Find out about Morningstar’s editorial policies.

 United States