
What’s the Difference Between the CPI and PCE Indexes?
Inflation is top of mind for investors, but there’s more than one way to measure consumer prices.


When most investors think about inflation, they think about the Consumer Price Index. But for the Federal Reserve’s decisions on interest rates, another government report looms larger: the Personal Consumption Expenditures Price Index. When Fed officials talk about their 2% target for inflation, it’s the PCE Index they are referring to, not the CPI.
What complicates matters is that the PCE and CPI can paint different pictures of inflation pressures, especially in the short term.
What Is the PCE Index?
The CPI generally makes front-page news. Compiled by the Department of Labor, it’s the most mainstream measure of consumer price changes. Annual CPI inflation clocked in at 3.4% in August.
Meanwhile, the PCE Index is part of the monthly Personal Income and Outlays report from the Bureau of Economic Analysis, which is usually put out about two weeks after the CPI report. In August, the PCE also measured inflation at 3.4% on an annual basis. That’s higher than the Fed’s 2% target. While the two measures of inflation sometimes produce the same rate of price changes (as in August), they more often diverge from each other.
What’s responsible for the difference? Here’s what investors need to know.
CPI vs. PCE
The building blocks of the PCE and CPI inflation calculations are largely the same. Each index attempts to quantify changes in consumer prices by tracking changes in the prices of a specific basket of goods and services each month. When prices in that overall basket rise more quickly over a certain period, so does the inflation rate.
“Over long periods, [the CPI and PCE] tend to naturally track each other because they’re using much of the same source data, but sometimes there can be big divergences,” says Preston Caldwell, chief US economist at Morningstar. Differences in the formulas, components, and weights of each index mean they can paint slightly different pictures of price pressures.
CPI inflation generally runs about 0.4 percentage points higher than PCE inflation, though that gap has been larger at times, like in the summer of 2022.
More recently, PCE inflation has been running higher than CPI inflation.
Why Do PCE and CPI Diverge?
Differences in how components are weighted in the two indexes are often responsible for divergent CPI and PCE inflation readings. That’s especially true in recent months. In July, there was a 0.4-percentage-point gap between PCE and CPI inflation. There was an even larger gap of 0.9 points in the “core” measure of each index, which excludes volatile food and energy prices. Energy prices have been a strong driver of inflation in 2026, and have a higher weight in the CPI Index.
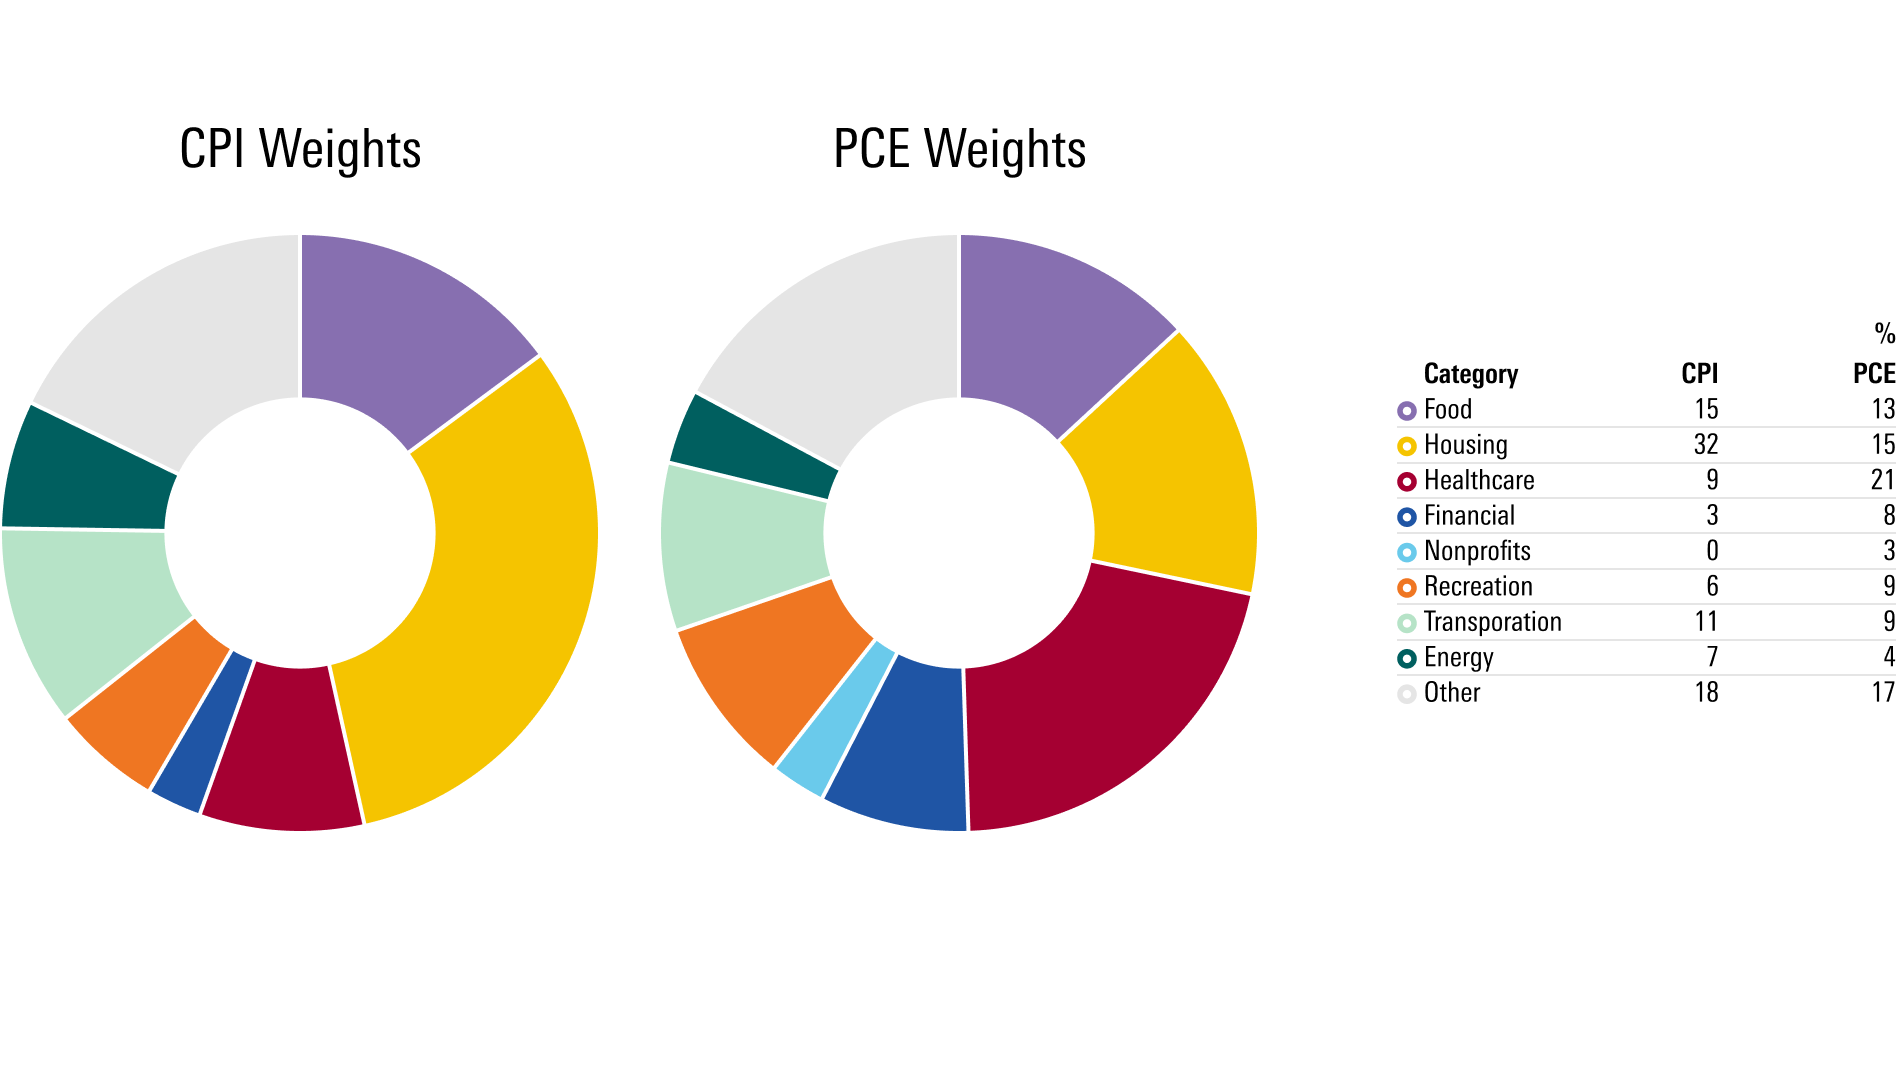
More broadly, Caldwell says the divergence comes down to “a lot of little things.” There’s more data that shows inflation in the software and financial services categories in the PCE Index, for instance, while used car prices carry a lower weight. Shelter prices are weighted roughly double in the CPI Index what they are in the PCE. On the other hand, healthcare spending is weighted much more heavily in PCE data.
Inflation Index Weights
Other Factors Driving Differences in CPI and PCE
Analysts point to other elements responsible for the differences in the two indexes. They’re calculated using different mathematical processes. For example, the PCE formula adjusts its weights monthly, while the CPI does so yearly. When grocery shoppers switch to chicken after beef becomes more expensive, that change shows up in the PCE Index first.
There are also differences in the scope of each index. The PCE report includes purchases by urban and rural consumers, while the CPI report only tracks spending in urban areas. The CPI includes only out-of-pocket spending made directly by consumers, while the PCE accounts for expenditures made on consumers’ behalf. As a result, health insurance expenses on behalf of employees paid by employers, Medicare, or Medicaid are included in the PCE basket but not the CPI. PCE data also includes spending by nonprofit organizations on households’ behalf.
Other factors include the differences in seasonal adjustment methodologies and the price data used to calculate spending in similar categories. The insurance price calculations in the CPI index tend to produce more volatile price swings than the PCE index, for example.
Why Does the Fed Prefer the PCE Over the CPI?
The Fed has used PCE inflation as its main measure of price pressures in the US economy since 2000. Former St. Louis Fed President James Bullard has named several reasons for this.
First, PCE data is more comprehensive than CPI data. It includes a broader subset of goods and services prices, as well as spending from both rural and urban consumers.
Second, the weights in the PCE are updated more frequently and can better account for consumer substitution. “The PCE can quickly reflect the impact of new technology or an abrupt change in consumer spending patterns,” Bullard wrote in 2022, citing how consumption shifted rapidly from services to goods at the onset of the covid-19 pandemic.
Lastly, the government can retroactively revise PCE data to account for new data or measurement techniques. CPI data is generally only revised to account for seasonal factors.
Should Investors Focus on the CPI or PCE?
Investors have plenty of options for tracking inflation. CPI inflation tends to make headlines because it is released before PCE inflation data and contains much of the same source material. “When you get the CPI release, most of the news about the PCE Index is already out,” Caldwell notes. As a result, unexpectedly good or bad CPI data can strongly impact financial markets. But he adds that the PCE data is a more comprehensive picture of price pressures because of its larger scope and more thorough methodology.
It’s clear that however you slice the data, both indexes have their merits. And with inflation top of mind for the Fed, investors will closely watch PCE data in the coming months.
Editor’s Note: A previous version of this article was published on September 27, 2024.
The author or authors do not own shares in any securities mentioned in this article. Find out about Morningstar’s editorial policies.

 United States