
Active ETFs Shine Amid US Funds' Slow Start in 2025
US equity funds suffered nearly $11 billion of outflows in January, their worst showing since April 2024.



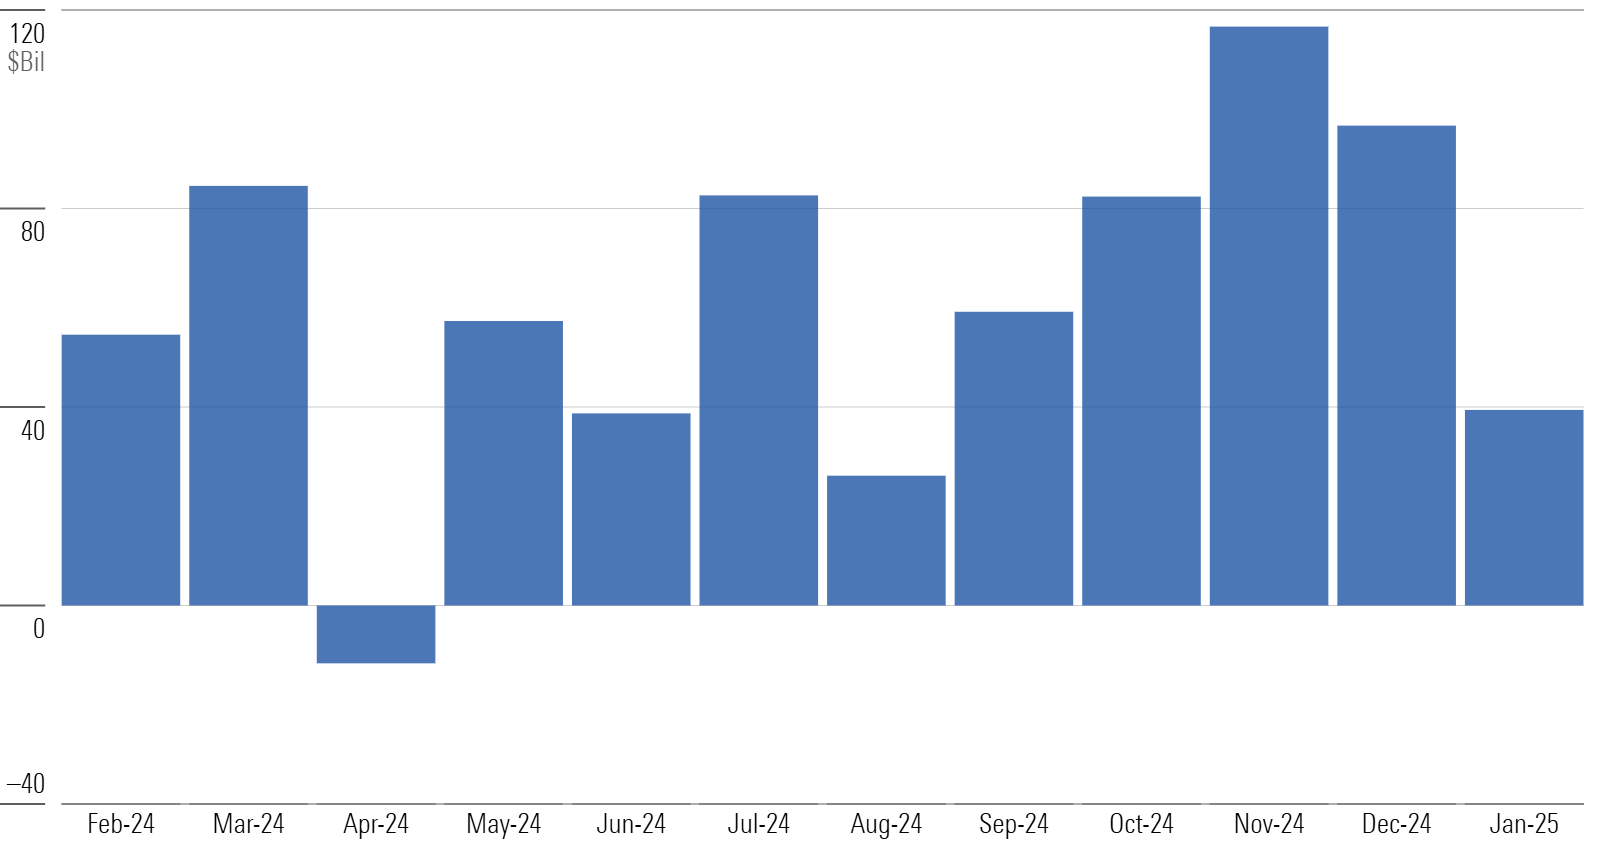
Long-term US open-end funds and exchange-traded funds gathered just $39 billion in January 2025, their weakest showing since August 2024. Appetite for equity funds was noticeably weak, save for sector funds. Investors seemed to hit pause amid a slew of news and uncertainty from the new presidential administration. Safe-haven asset classes, such as fixed income, and diversifiers, such as alternatives, fared better.
Long-Term US Flows
Active ETFs Steal the Show in January
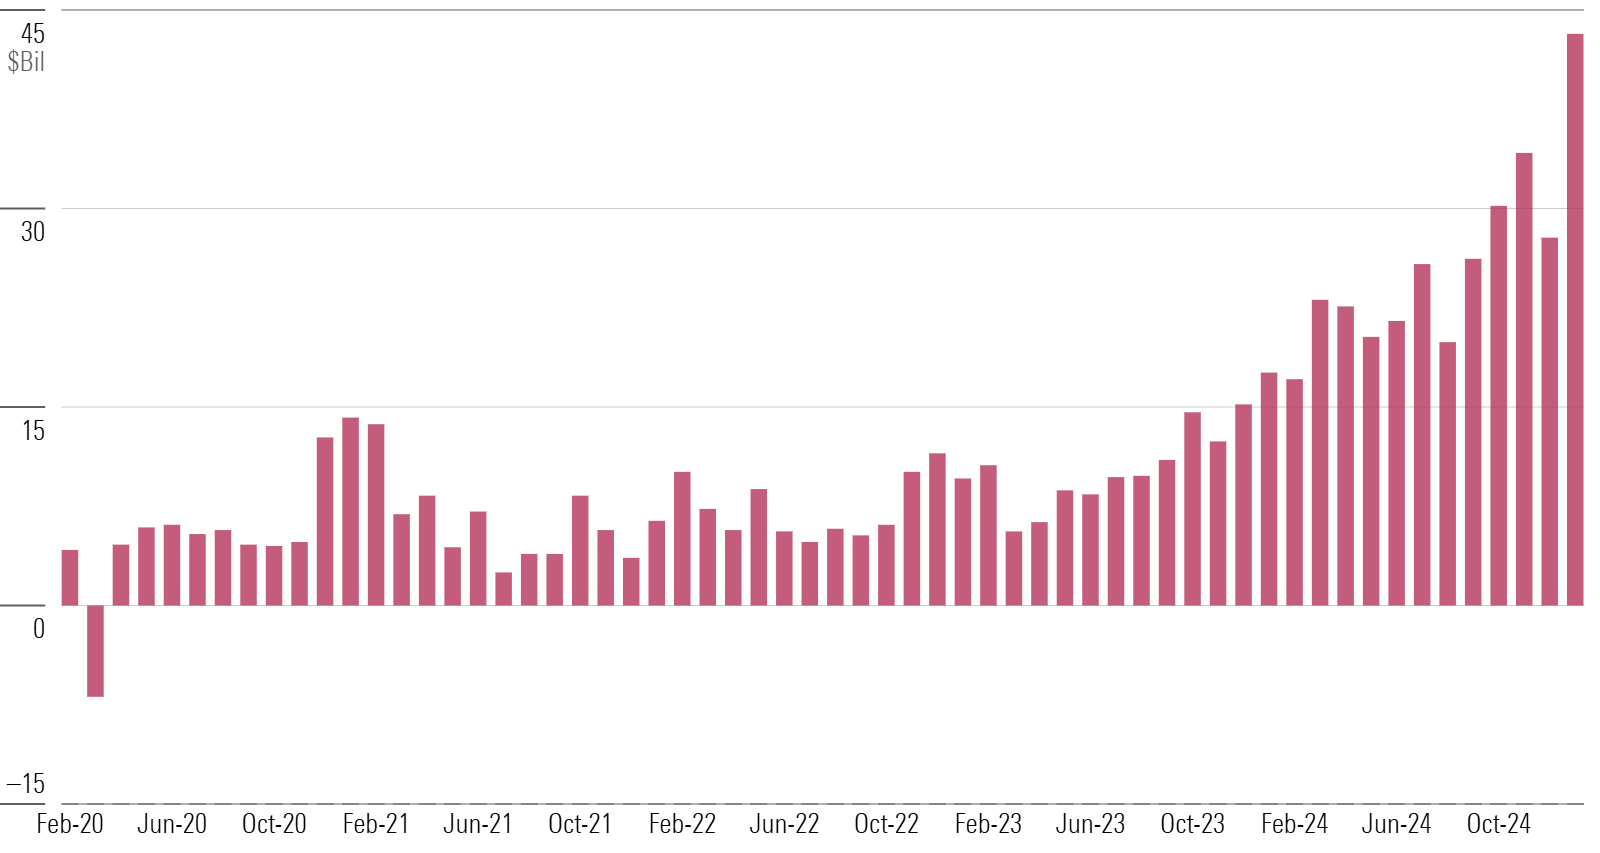
Investors piled a record $43 billion into actively managed ETFs in January. Records have become routine for active ETFs, whose monthly inflows marked new all-time highs six times in 2024. Still, January’s inflows stood out—they translated into a 5% organic growth rate, the best since February 2021.
Active ETF Flows
Ultrashort-Bond Flows Pace All Categories
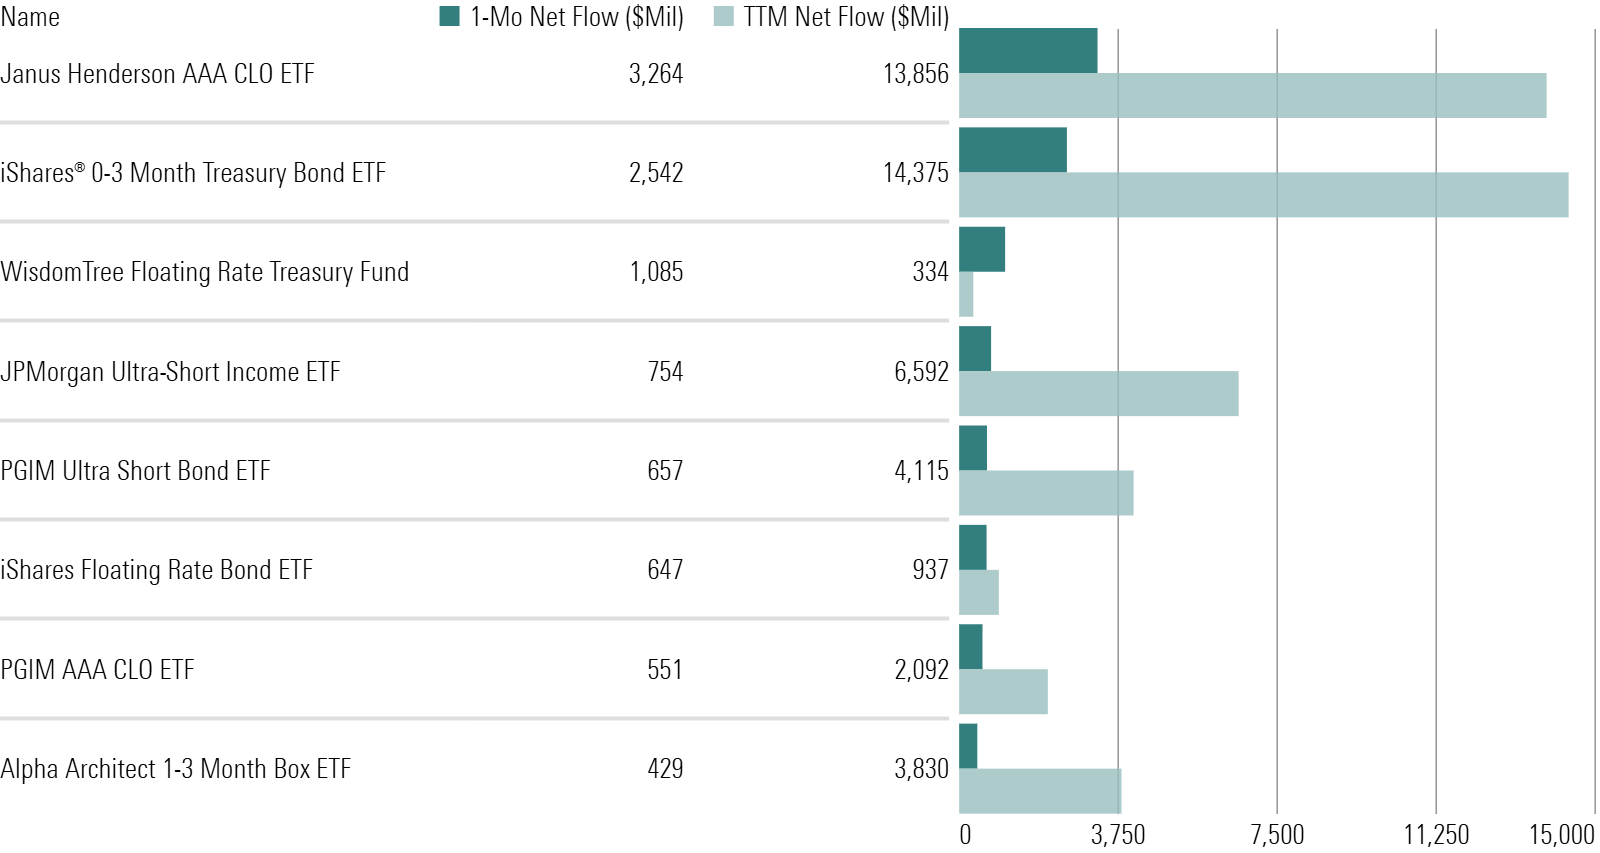
The ultrashort bond Morningstar Category raked in $12.6 billion in January thanks to a band of red-hot ETFs. Janus Henderson AAA CLO ETF JAAA led the pack with a fresh $3 billion haul. A pair of PGIM products—one a fellow collateralized loan obligation strategy—combined for over $1 billion of inflows. These products function as cash alternatives with more attractive yields, meeting investors’ desire for safety while generating income and preserving some upside.
Ultrashort-Bond Flows
US Equity Investors Buy the Rumor, Sell the News
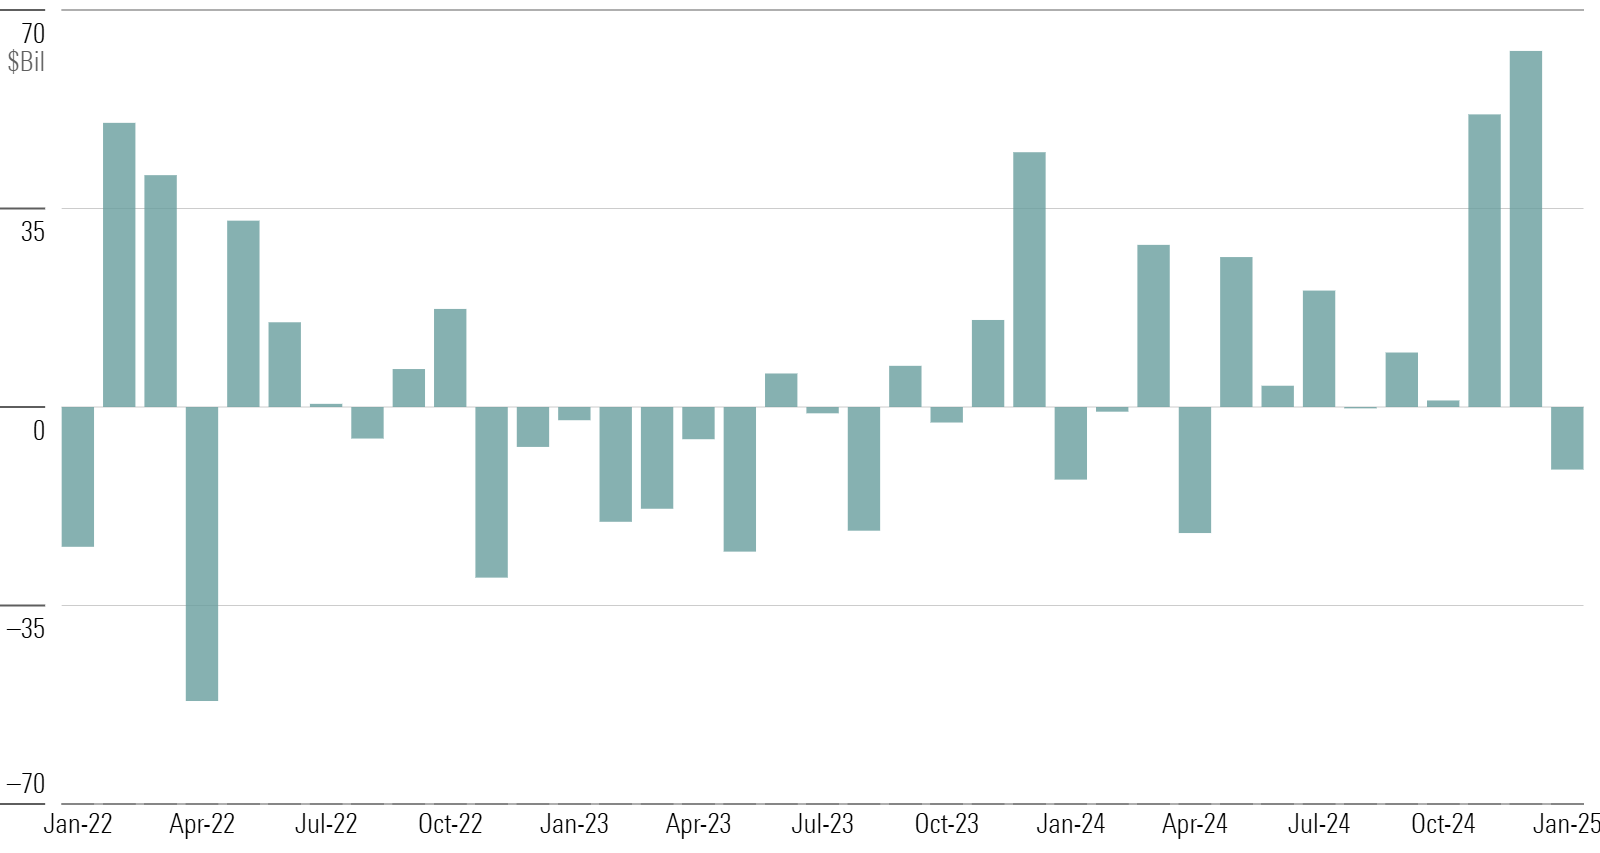
US equity funds suffered nearly $11 billion of outflows in January, their worst showing since April 2024. This comes after two roaring months in November and December, which both saw over $50 billion of inflows. Investors may have gotten cold feet amid the deluge of policy changes under the new presidential administration. Only the three blend categories (which house the largest index funds) within the group enjoyed inflows in January, though their pace was weak relative to recent history.
US Equity Flows
Nontraditional Equity Funds Stay Hot in January
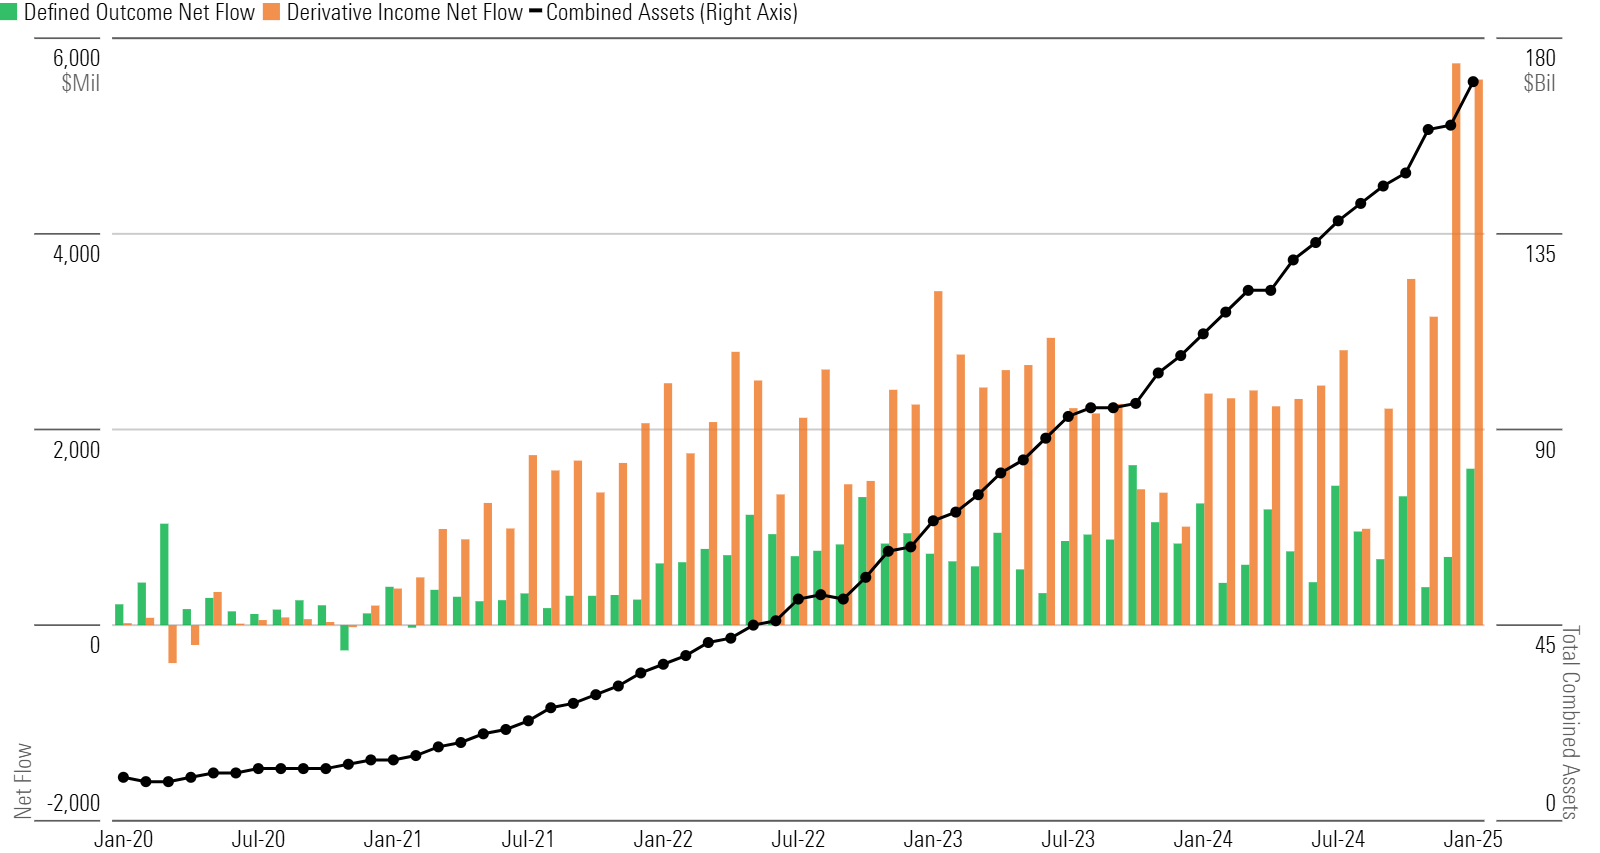
After taking in a record amount in December, nontraditional equity funds topped that mark in January with a $7.8 billion haul. Powered by covered-call ETFs in the derivative-income category and equity exposure with built-in hedges in the defined-outcome category, these funds continue to take share. Their current trailing 12-month organic growth rate of 29% is the second-highest among the 10 category groups, trailing only alternative funds’ 38%.
Nontraditional Equity Flows
The Active ETF Gold Rush’s Biggest Winners
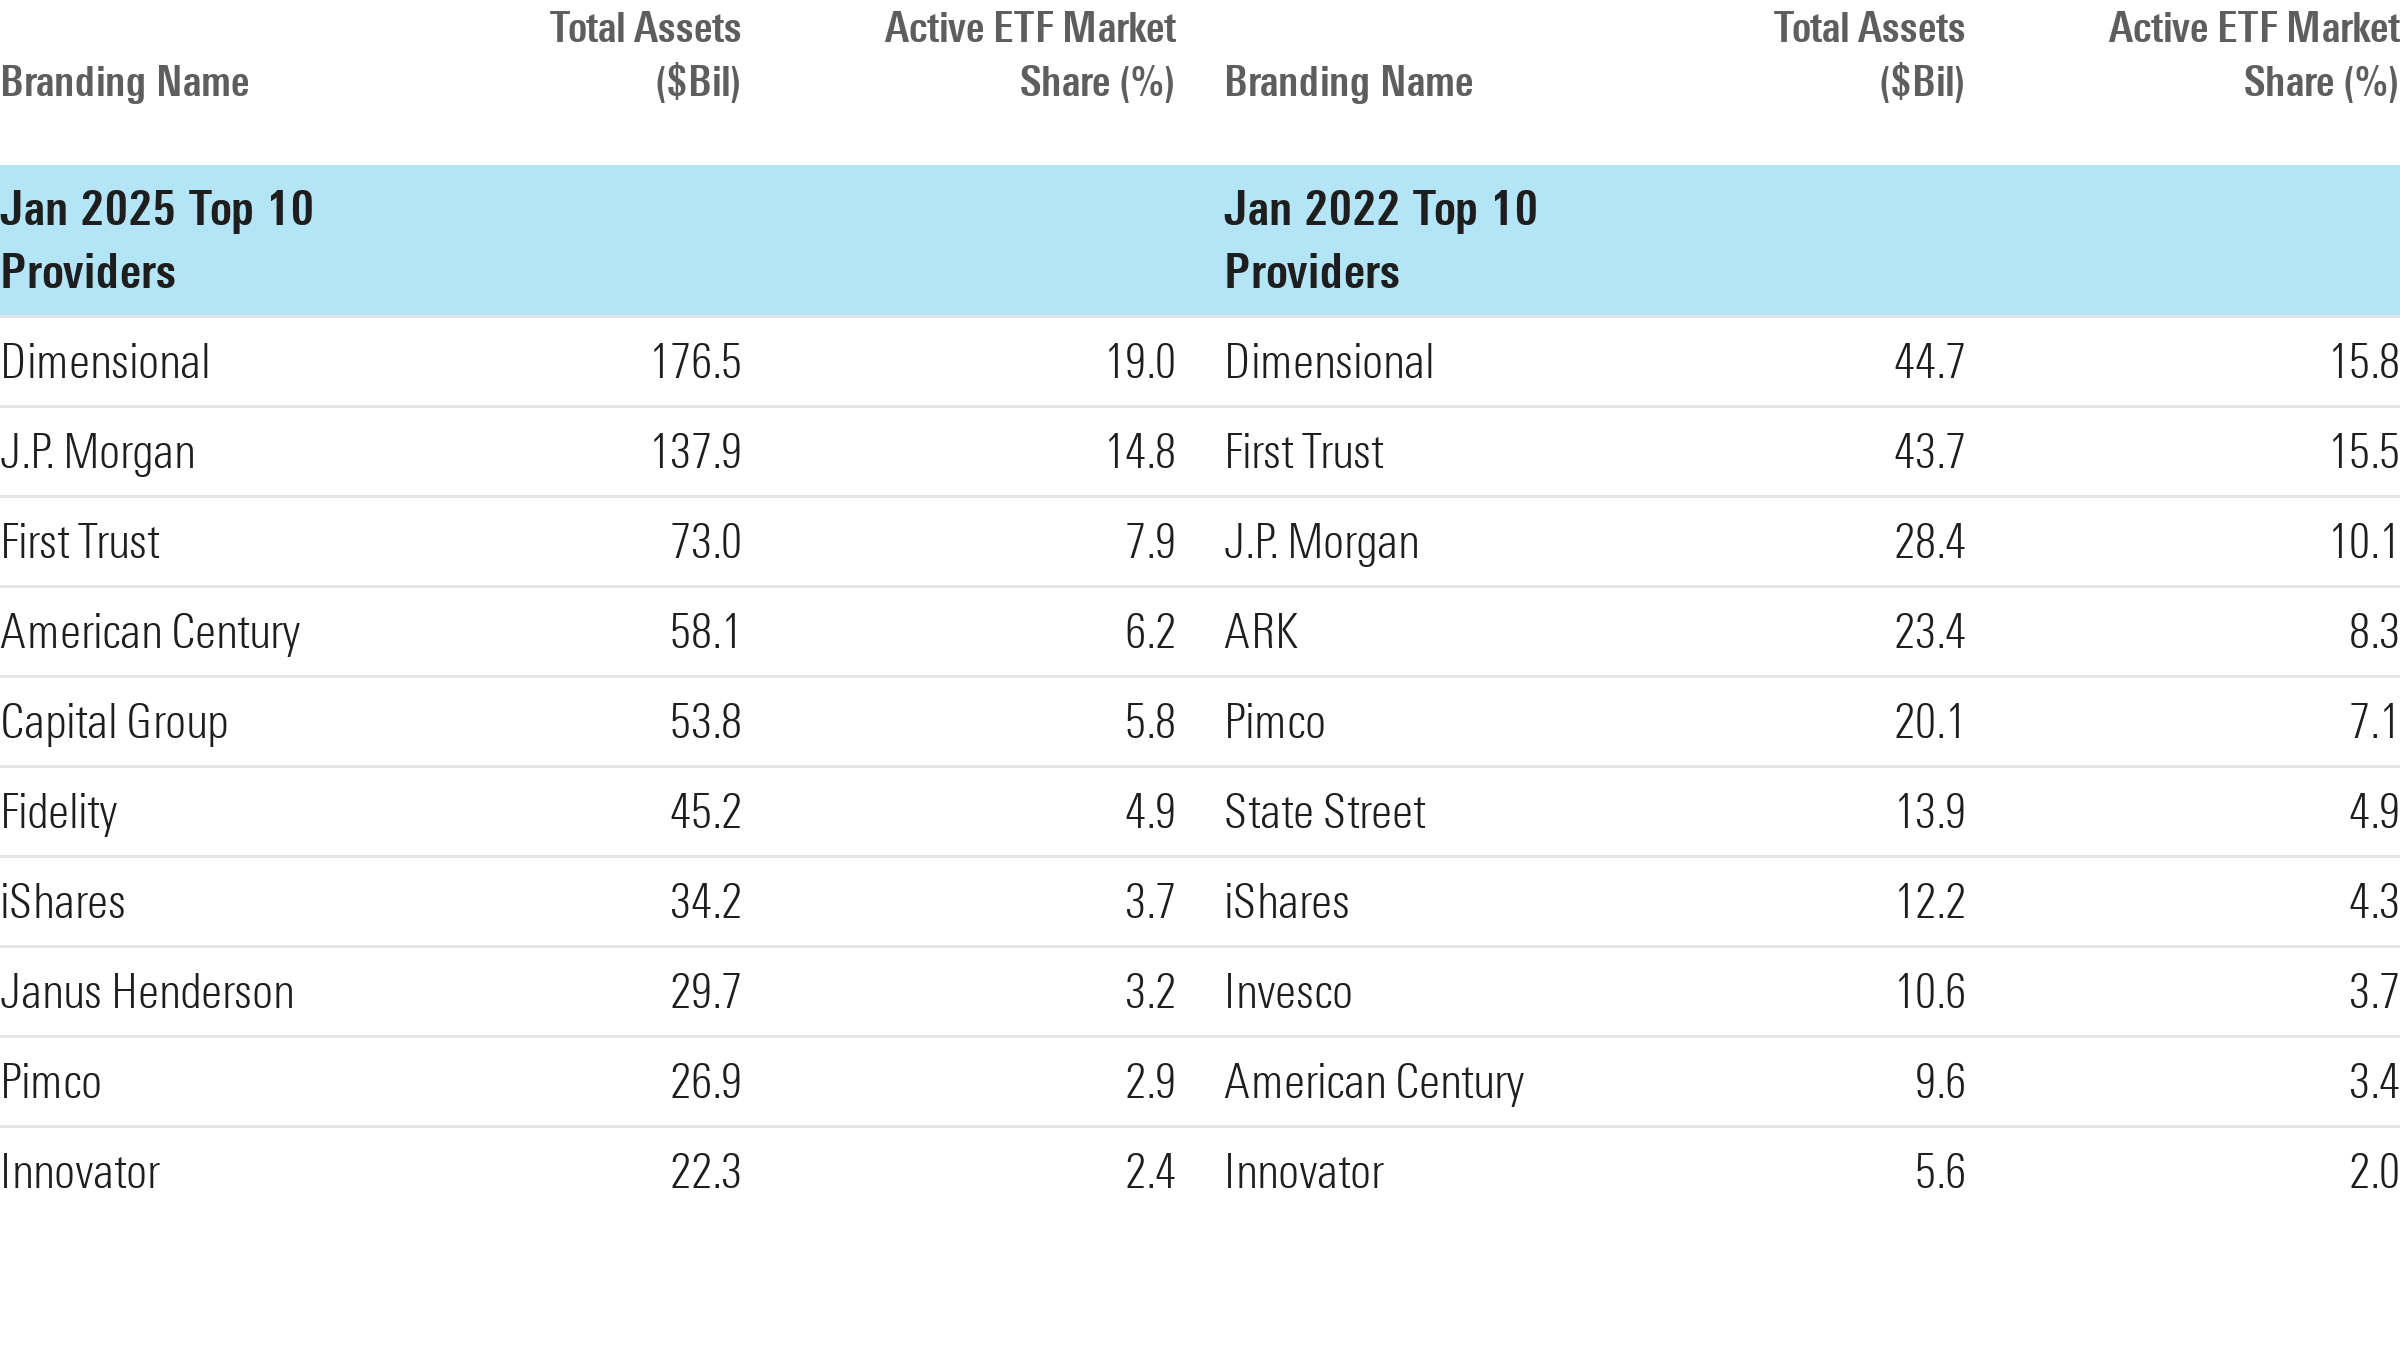
Active ETF assets have more than tripled over the past three years, but the largest firms competing for them haven’t changed much. Seven of the 10 largest active ETF providers today also made the list in January 2022. Dimensional, J.P. Morgan, and American Century increased their market share since then. Firms new to the table include Capital Group and Fidelity—longtime mutual fund giants whose ETFs have made a splash.
Top Active ETF Providers
This article is adapted from the Morningstar Direct US Asset Flows Commentary for January 2025. Download the full report here.
The author or authors do not own shares in any securities mentioned in this article. Find out about Morningstar’s editorial policies.

 United States