
Better Conditions Did Not Yield Better Results for Active Managers in 2025
Long-term trends help investors identify where to go active despite a challenging 12 months for active funds.


Markets climbed a wall of worry in 2025. Stocks, gold, and digital assets ended near-record highs despite heightened geopolitical, trade, and valuation risks throughout the year.
Despite a wide dispersion of performance between sectors and themes, active managers failed to find a foothold to overtake passive managers in 2025. Of the 3,140 active funds included in our analysis, 38% survived and outperformed their average passive peer in 2025.
We further analyze these findings in the year-end 2025 installment of the Morningstar Active/Passive Barometer, a semiannual report that measures the performance of US active funds against passive peers in their respective Morningstar Categories. The Active/Passive Barometer spans over 9,200 unique funds that accounted for approximately $26 trillion in assets, or about 67% of the US fund market. The full report can be found here.
Most Active Managers Failed to Capitalize on Volatility
In theory, market volatility sets the table for active managers to navigate macro trends and identify winning themes. This rarely ends up being the case for the average active manager, and last year was no different. April’s tariff tantrum head-faked active managers into a defensive posture right as markets recovered. Rate cuts steepened yield curves as inflation risks eased in the short term but remained a longer-term concern. Artificial intelligence propelled stock markets higher by pairing communication services and tech stocks with utilities to power them. International stocks awoke from a long slumber to easily outstrip the US market in US-dollar terms.
Shifting expectations defined fixed-income fund performance. Stubborn long-term rates and periods of widening credit spreads left riskier strategies mostly in the cold. The changing shape of the yield curve drove the biggest decline in success rates from this year’s report in the corporate-bond Morningstar Category. Passive corporate bond funds concentrated right in the 5–7-year sweet spot on the curve, creating a nearly insurmountable benchmark for active managers to reach, given passives’ fee advantage and little opportunity to find a meaningful edge elsewhere. As a result, active corporate-bond managers saw a 63-percentage-point decline in success rates to 4.4% in 2025.
Active real estate managers’ success rates declined sharply as well. Passive options in the global real estate category tend to skew international, which sets a high bar for active managers, as US real estate broadly underperformed international last year.
Active managers found respite in the diversified emerging-markets category, where success rates increased 42 percentage points from 2024 to 64% in 2025. Category leader Nomura Emerging Markets pinned its success to South Korean and tech stocks, two winning trends that set it far apart from category peers (particularly those that consider South Korea a developed market).
Year-Over-Year Change in Active Funds' One-Year Success Rate by Category (%)
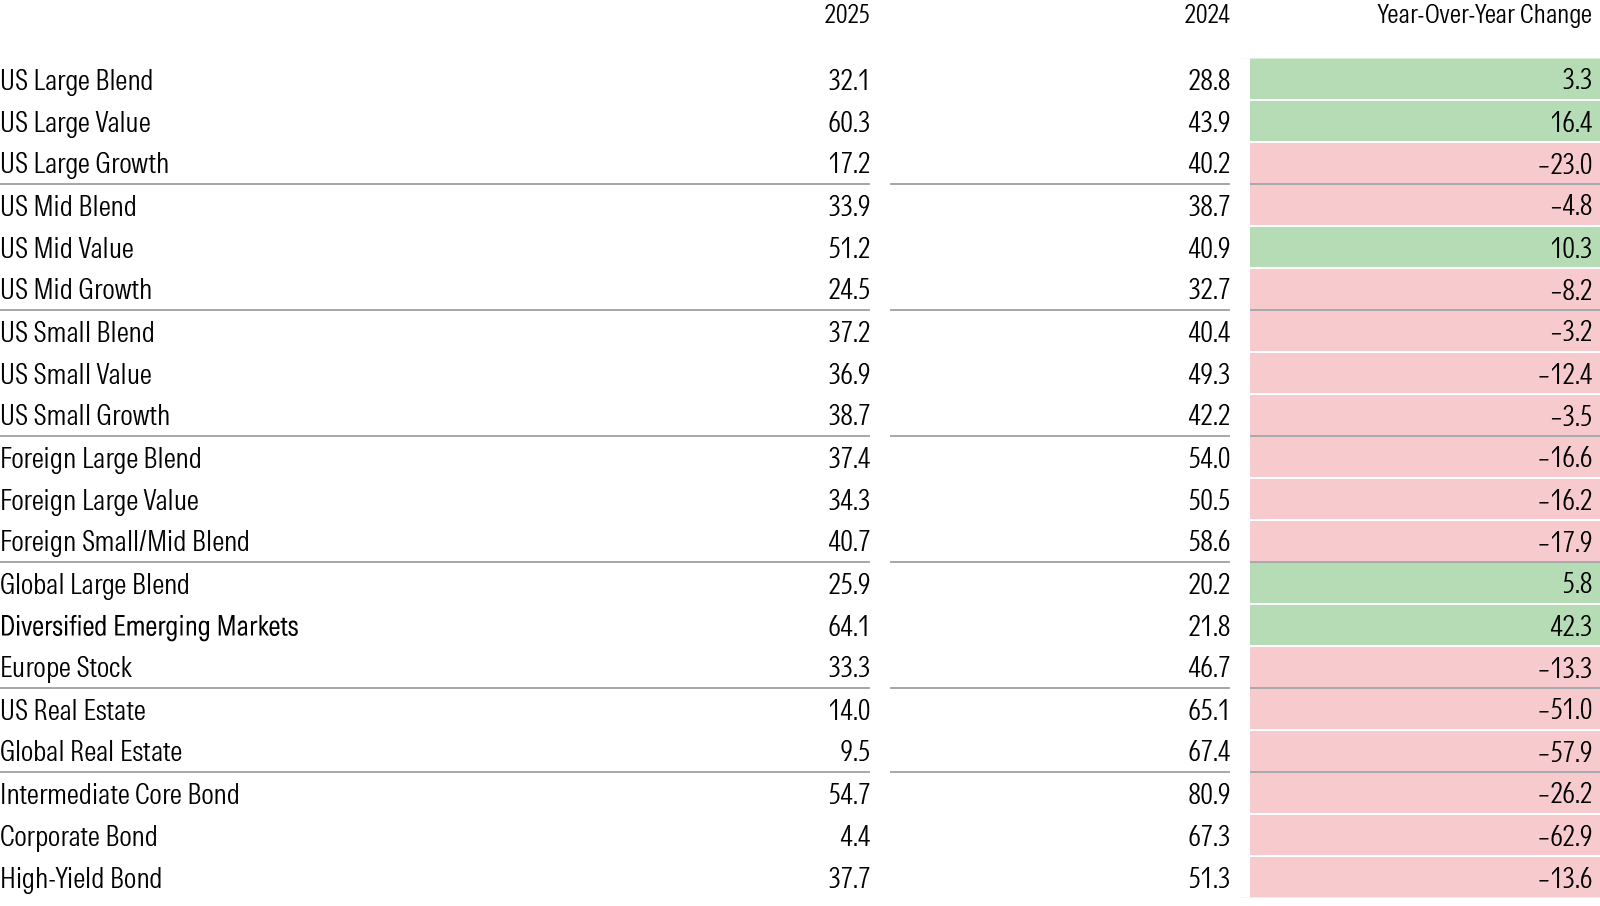
But one year isn’t a sufficient time horizon from which to draw conclusions. Success rates can fluctuate wildly from year to year, depending on what’s going on in markets.
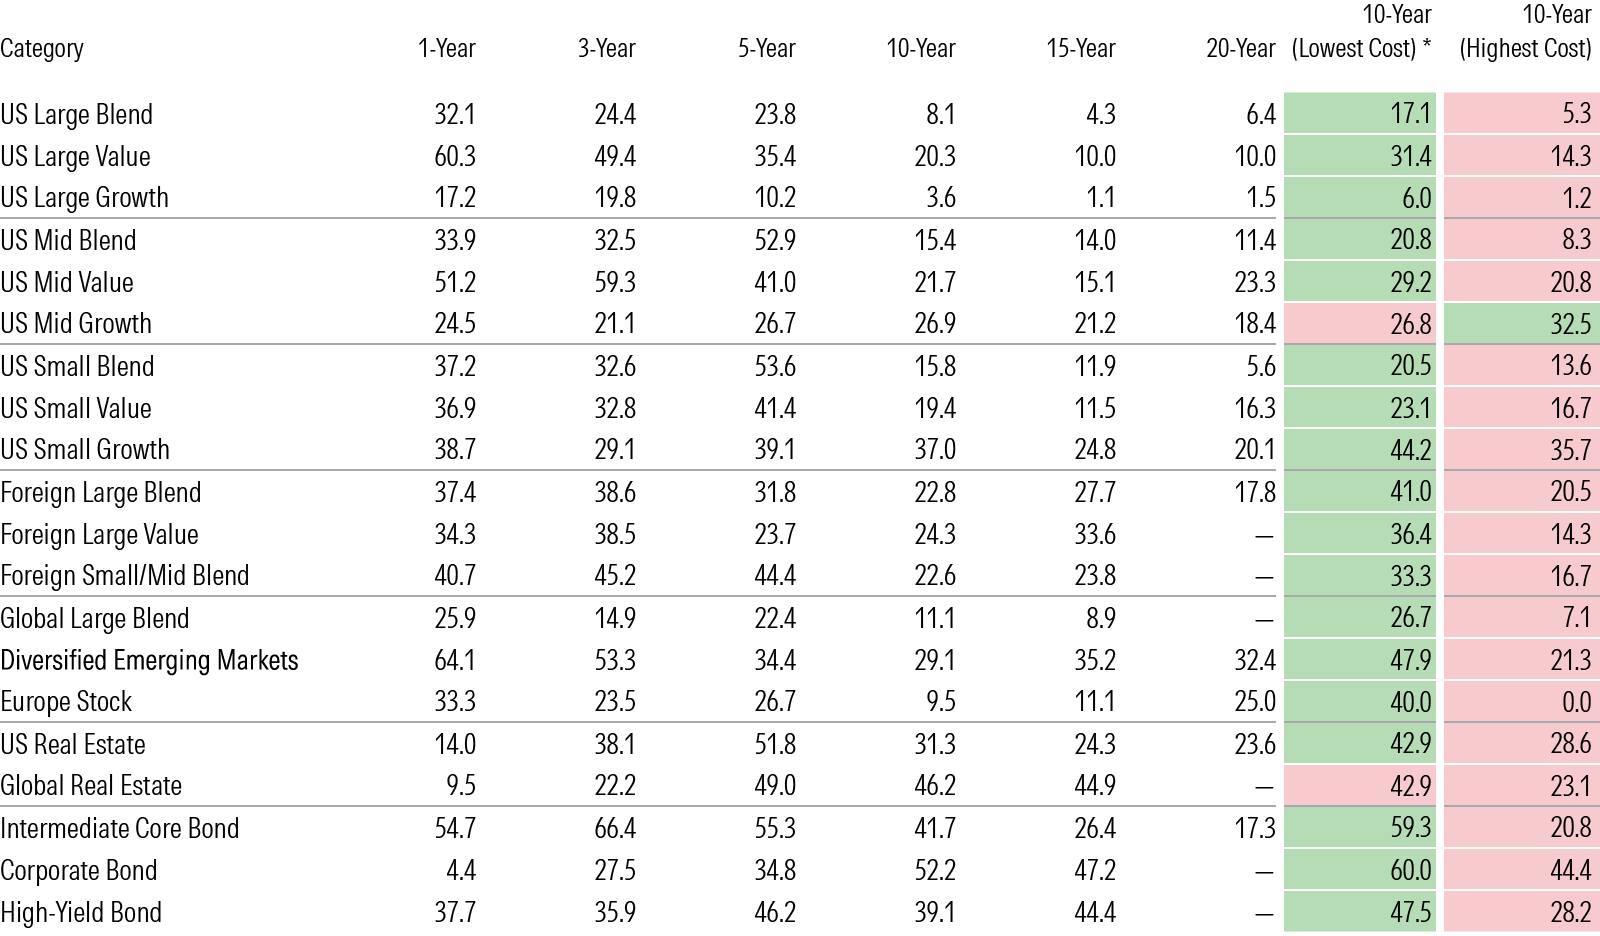
Longer horizons provide stronger signals that investors can incorporate in their selection process. In general, actively managed funds have failed to survive and beat their benchmarks, especially over longer time horizons. About one out of every five active funds topped the average of their passive rivals over the 10 years through 2025.
But success rates vary across categories. Long-term success rates were highest among bond and real estate funds, where active management may hold the upper hand. Investors can use this data to identify areas of the market where they have better odds of picking winning active funds.
Active Funds' Success Rate by Category (%)
Sizing Relative Performance of Passive and Active Investing
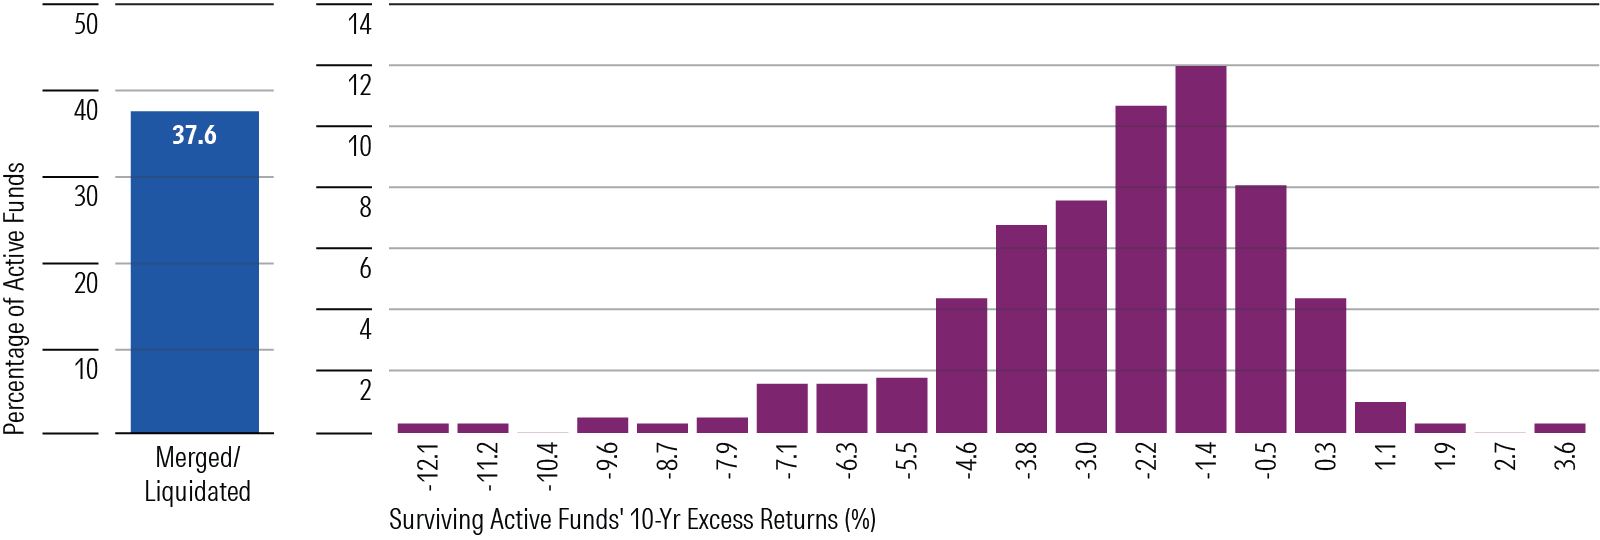
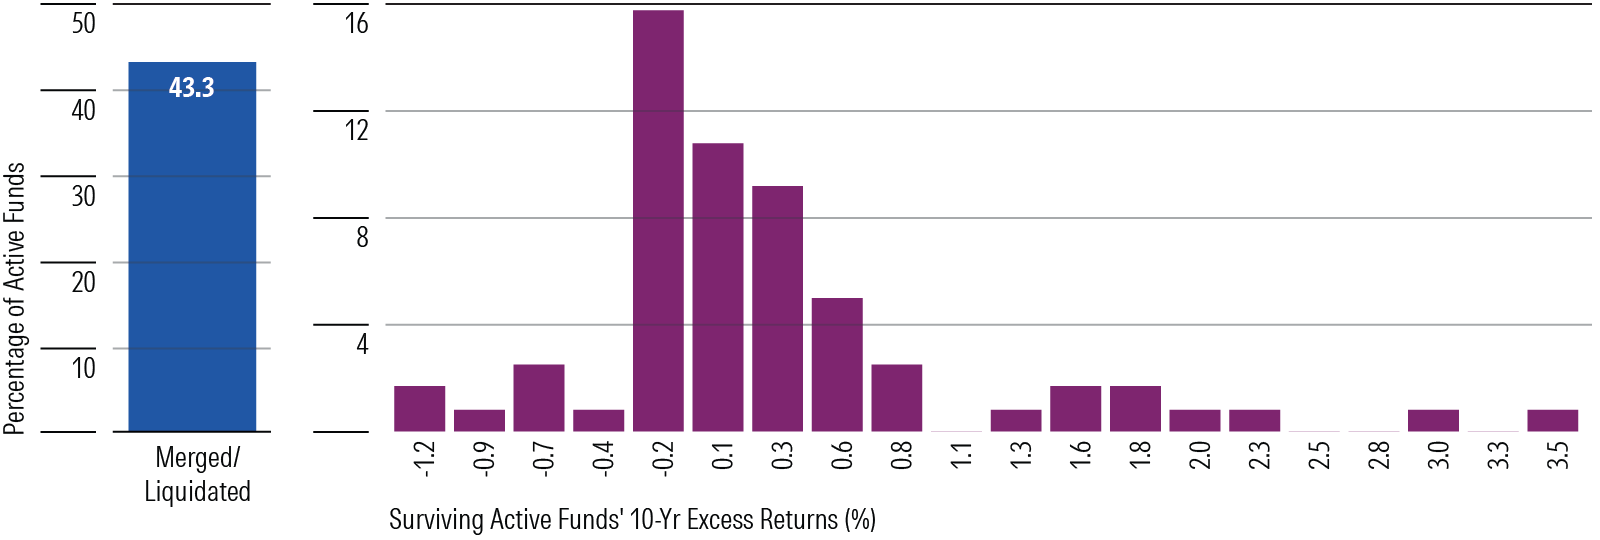
Success rates alone only tell half the story. The other half is the prospective payoff for choosing a winning fund versus the penalty for picking a loser. The Active/Passive Barometer plots this information in the form of the distribution of 10-year excess returns for surviving active funds versus the average of their passive peers.
Much like success rates, these distributions vary by category. In the case of US large-cap funds, the distributions skew heavily negative. This paints a bleak picture for active funds in these categories. They have low long-term success rates, and penalties can be high for picking a loser.
The opposite tends to be true of fixed-income and real estate categories, where long-term success rates have generally been higher and excess returns among surviving active managers skewed positive over the past decade. The distributions of excess returns for surviving active funds from the large-blend and intermediate-core bond categories illustrate this trend well.
Distribution of 10-Year Annualized Excess Returns for Surviving Active Large-Blend Funds
Distribution of 10-Year Annualized Excess Returns for Surviving Active Intermediate Core Bond Funds
Costs Matter for Both Passive and Active Strategies
A signal that rings clear is that fees matter. Funds in the cheapest quintile succeeded more often than funds in the priciest one (31% success rate versus 17%) over the 10-year period through 2025.
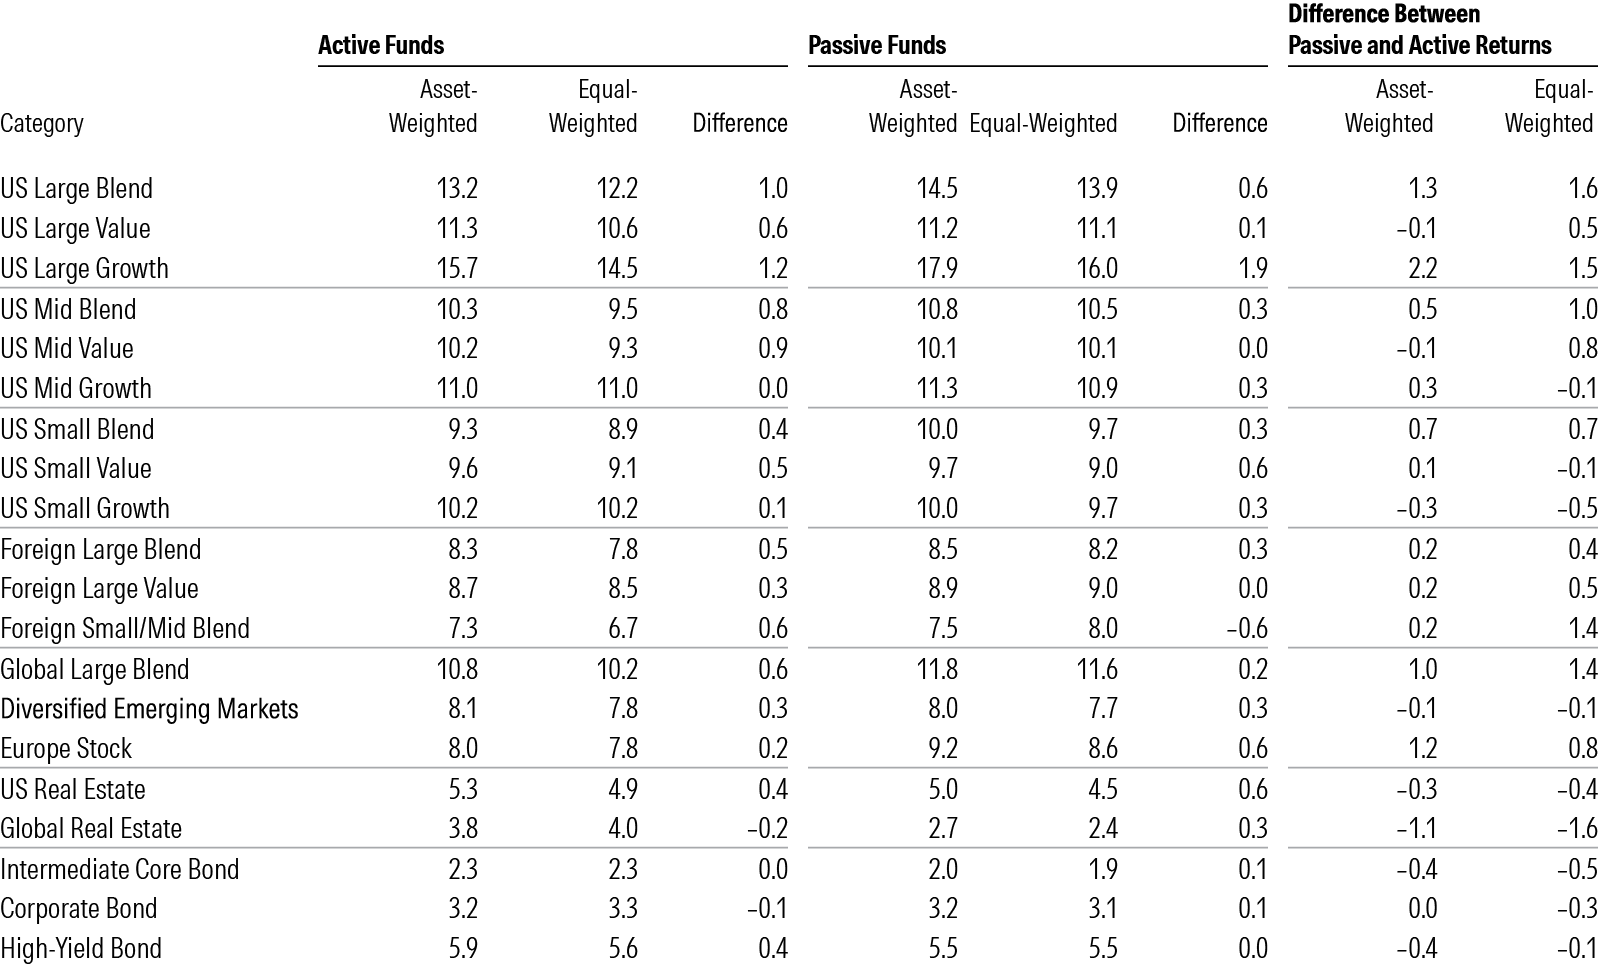
Investors have caught on. Over the past 10 years, the average dollar invested in active funds outperformed the average active fund in 17 of the 20 categories examined. That implies investors have found cheaper, higher-quality strategies.
Comparison of Asset- and Equal-Weighted 10-Year Returns (%)
The author or authors do not own shares in any securities mentioned in this article. Find out about Morningstar’s editorial policies.

 United States