
Cloudy Markets Didn’t Scare ETF Investors in October
US ETFs raked in $125 billion in another stellar month of inflows.


This article mentions funds that have an issuer-initiated rating and/or track a Morningstar Index. For full disclosure information, please refer to the specific funds, which are demarcated with a * symbol, listed below.
Key Takeaways
- The Morningstar Global Markets Index, a broad gauge of global equities, slid 2.4% after five straight months of gains
- The Morningstar US Core Bond Index fell 2.5% in its first negative month since April
- Neither fact deterred exchange-traded fund investors, who poured more than $124 billion into ETFs in October
- US stock ETFs accounted for $57 billion of that total
- International stock ETFs raked in $17 billion behind a record $9 billion of flows into the China region category
- Healthy demand for actively managed strategies helped taxable-bond ETFs collect $28 billion in October
- Flows into commodity ETFs exceeded $1 billion for the fourth straight month thanks to stellar gold performance
- IShares gathered $34 billion to lead all ETF providers, but Vanguard still holds the 2024 lead
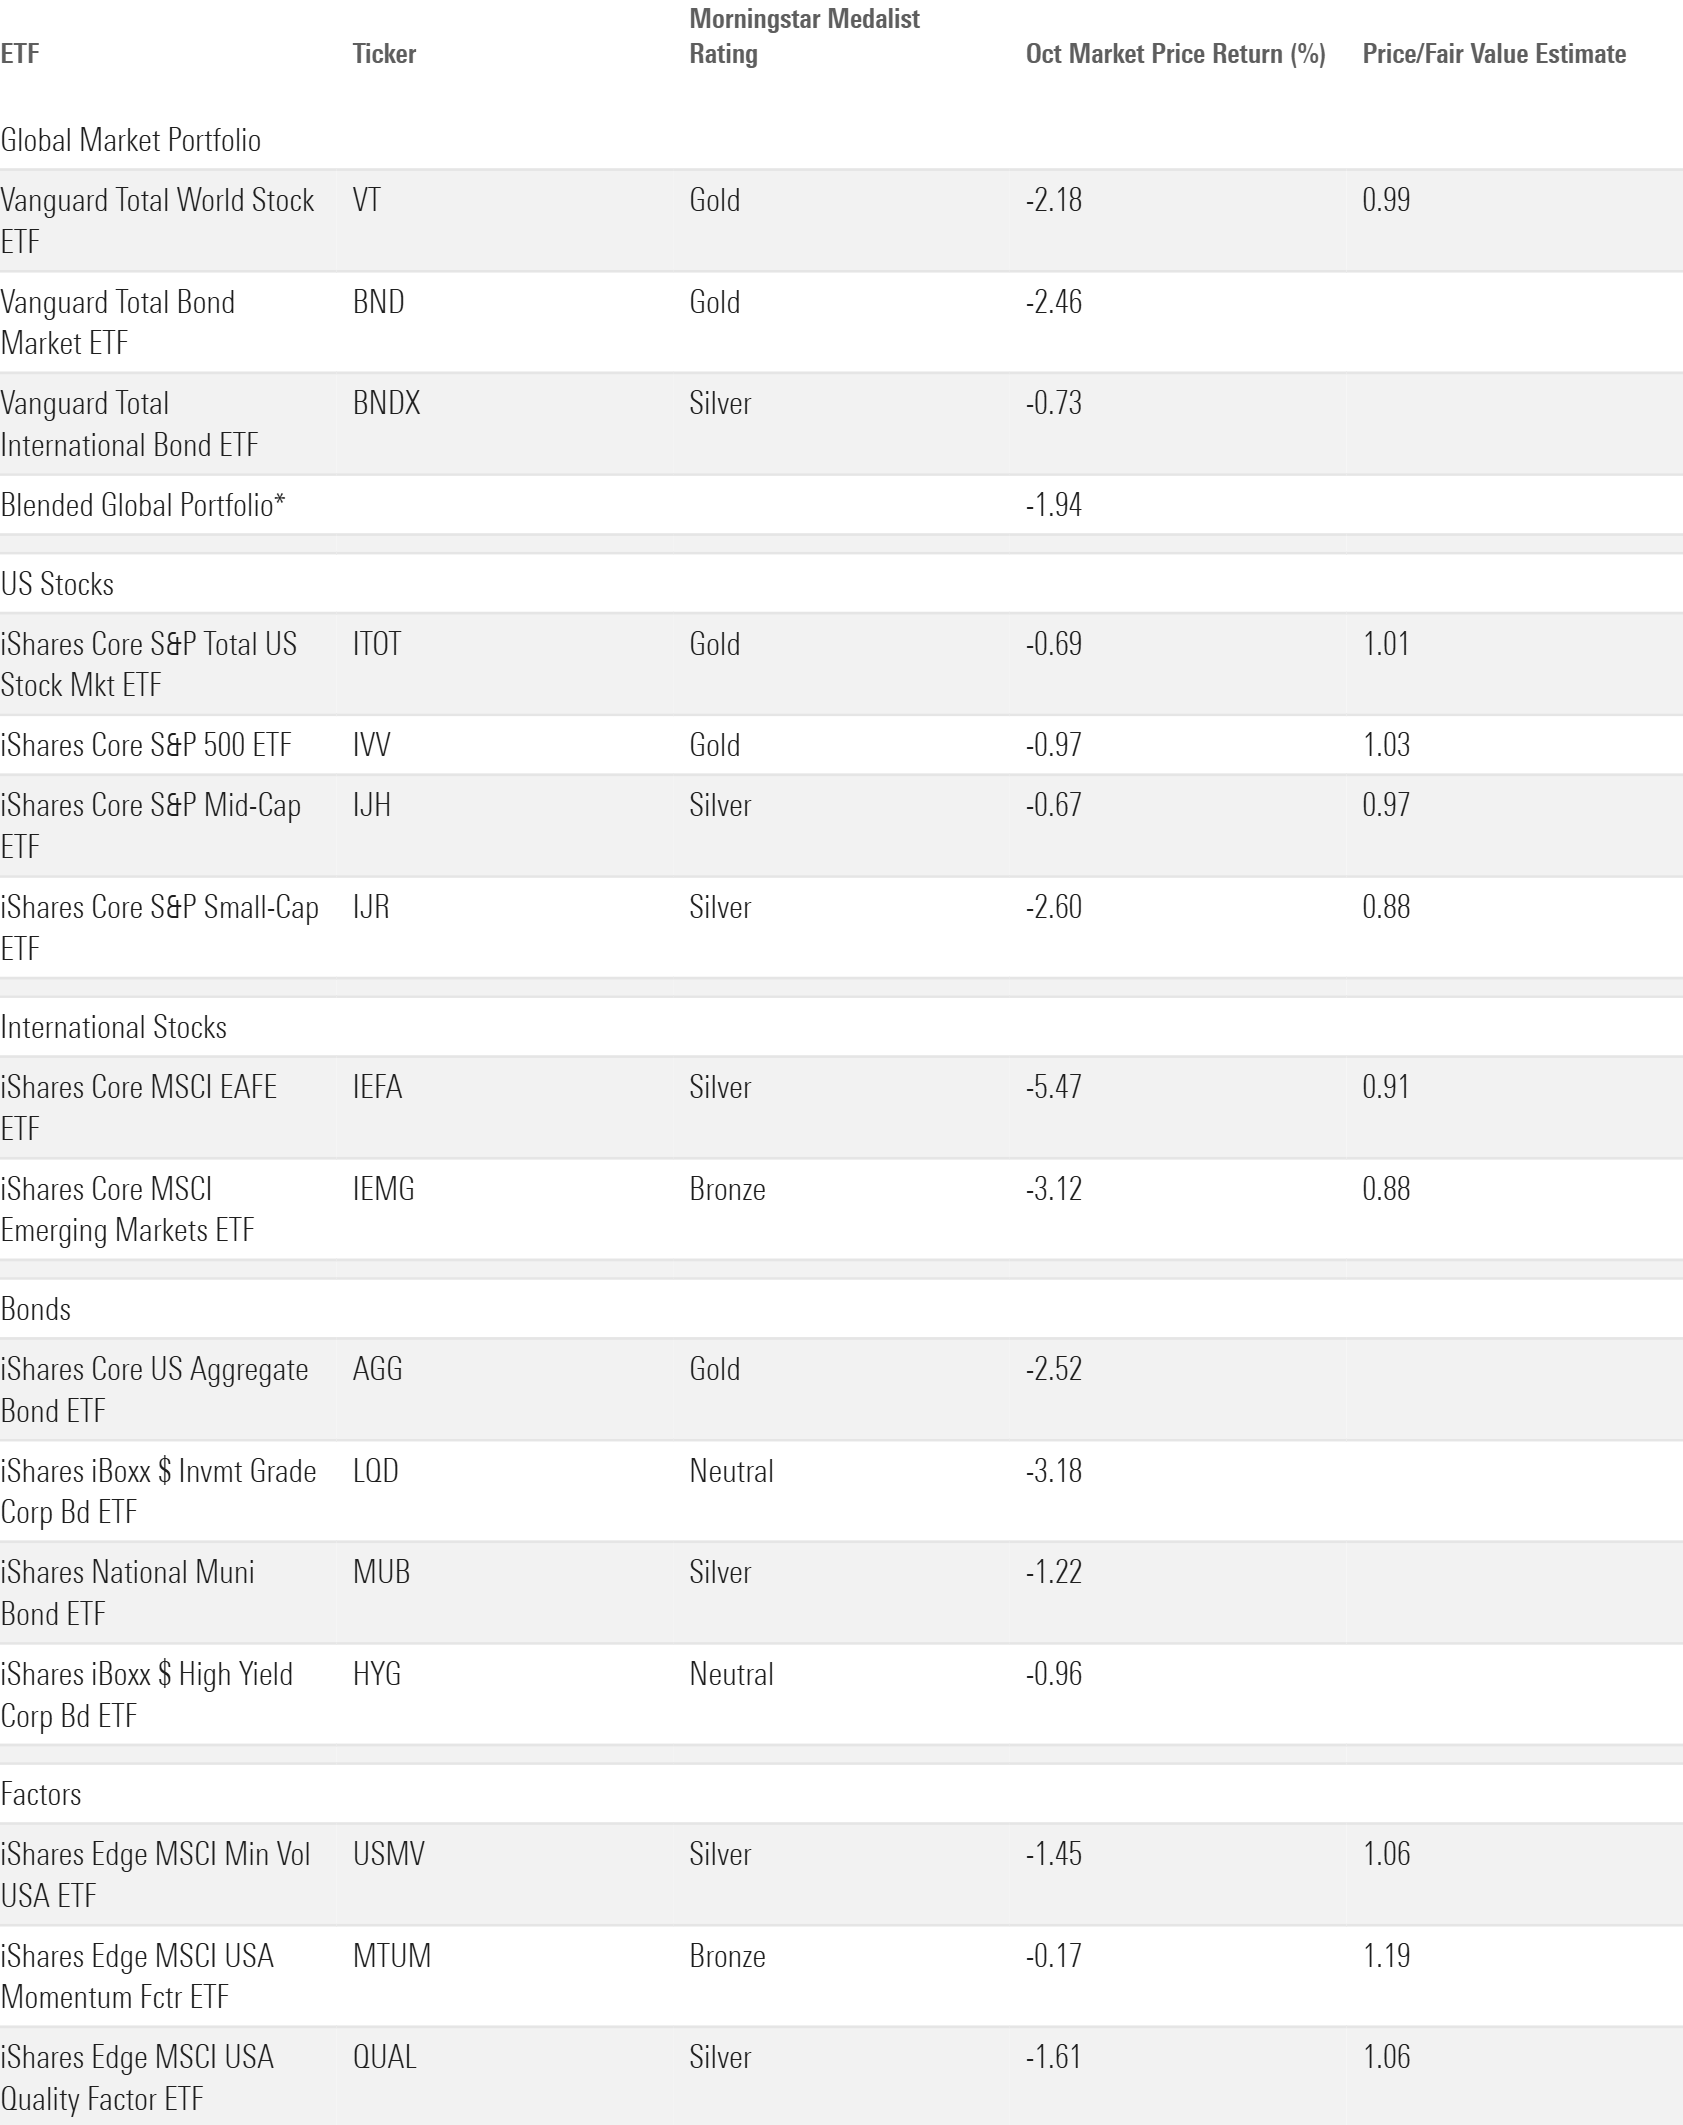
Exhibit 1 shows the October 2024 performance for a sample of analyst-rated ETFs that cover major sections of the stock and bond markets. A blended global portfolio lost 1.9% last month as its stock and bond components pulled back in October.
October Market Performance through the Lens of Analyst-Rated ETFs
Bond Market Summary
The bond sleeve failed to steady the blended portfolio in October. Vanguard Total Bond ETF BND slid 2.5%, its first negative month since April and the worst monthly return since September 2023. Growing concern about the size and future of the national debt may have contributed to the weak demand for Treasury bonds.
Mixed economic data that included warm inflation readings may have hurt bond prices as well. At the start of October, investors priced in roughly a one-in-three chance the Federal Reserve would cut rates by 50 basis points at the Nov. 7, 2024, meeting, according to the CME FedWatch tool. The market uniformly expected a 25-basis-point cut by the time the calendar turned to November, however. The change in expectations hurt long-term bond portfolios the most. IShares 20+ Treasury Bond ETF TLT slid 5.5% on the month, while iShares Short Treasury Bond ETF SHV scratched out a 0.4% gain. The Fed’s interest-rate cut in September offered TLT only a brief reprieve: It has now shed 3.7% for the year to date through October and a cumulative 31.5% over the past three years.
Bond funds built around credit risk did not avoid the pain altogether but fared better than most Treasury-laden rivals. SPDR Bloomberg High Yield Bond ETF JNK limited its October drawdown to roughly 1%. Narrowing credit spreads helped offset climbing Treasury yields for the portfolio of non-investment-grade corporate debt. Its 2024 return stood at 6.9% when the book closed on October. JNK will probably fall short of the 12.4% gain it notched in 2023, but it still led most broad bond indexes by roughly 5 percentage points with two months remaining.
Stock Market Summary
US stocks pulled back in October after five consecutive months of gains. Vanguard Total Stock Market ETF
VTI
Financial Select Sector SPDR ETF XLF led State Street’s suite of sector funds with a 2.6% return. The only others to join it with positive returns were those tracking the communication services (1.8% return) and energy sectors (0.9%). Bank stocks stood out within the financials sector. SPDR S&P Bank ETF KBE climbed 3.3% in October behind stellar performance from Wells Fargo WFC and a bevy of regional banks. Health Care Select Sector SPDR ETF XLV brought up the rear with a 4.6% October loss.
International Stock Market Summary
Foreign stocks slumped harder than their domestic peers in October. Vanguard Total International Stock ETF VXUS peeled back 4.5% in its worst month since September 2022. Neither developed- nor emerging-market stocks fared well: iShares Core MSCI EAFE ETF IEFA and iShares Core MSCI Emerging Markets ETF IEMG lost 5.5% and 3.1%, respectively. European stocks weighed heavy on the former. IEMG grappled with weak China-stock returns after their banner September but benefited from its near 20% allocation to companies based in Taiwan.
The emerging-markets index fund gained 11% for the year to date through October, leading IEFA by about 4.3 percentage points. It has not beaten the developed-markets fund in a calendar year since 2020, trailing by a cumulative 23 percentage points over that span.
ETF Flows
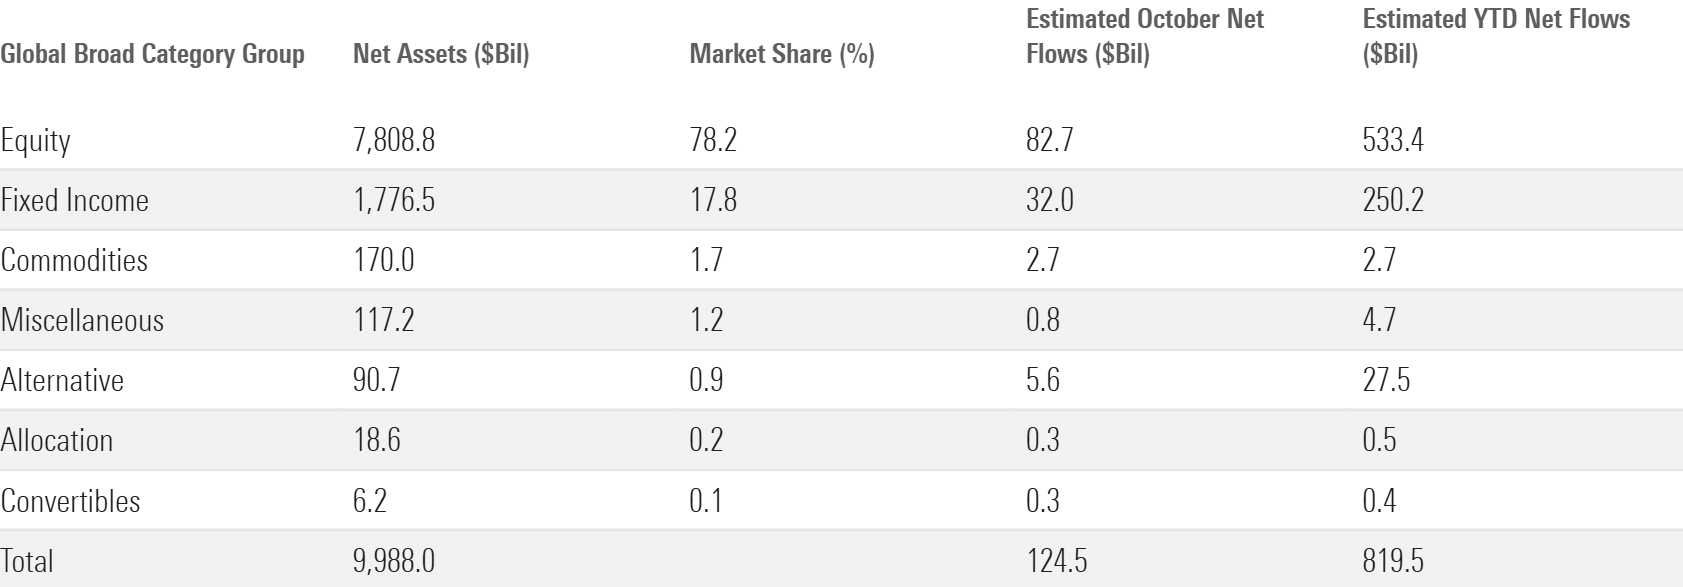
US ETFs raked in a fresh $125 billion in October 2024, the highest this calendar year. They have absorbed well over $800 billion on the year, putting them on pace to shatter the $900 billion annual record from 2021.
October Flows across Morningstar Broad Category Groups
Stock ETF Flows
US stock ETFs stayed on a tear in October. Investors piled $57 billion into them last month, pushing their 2024 haul to $389 billion.
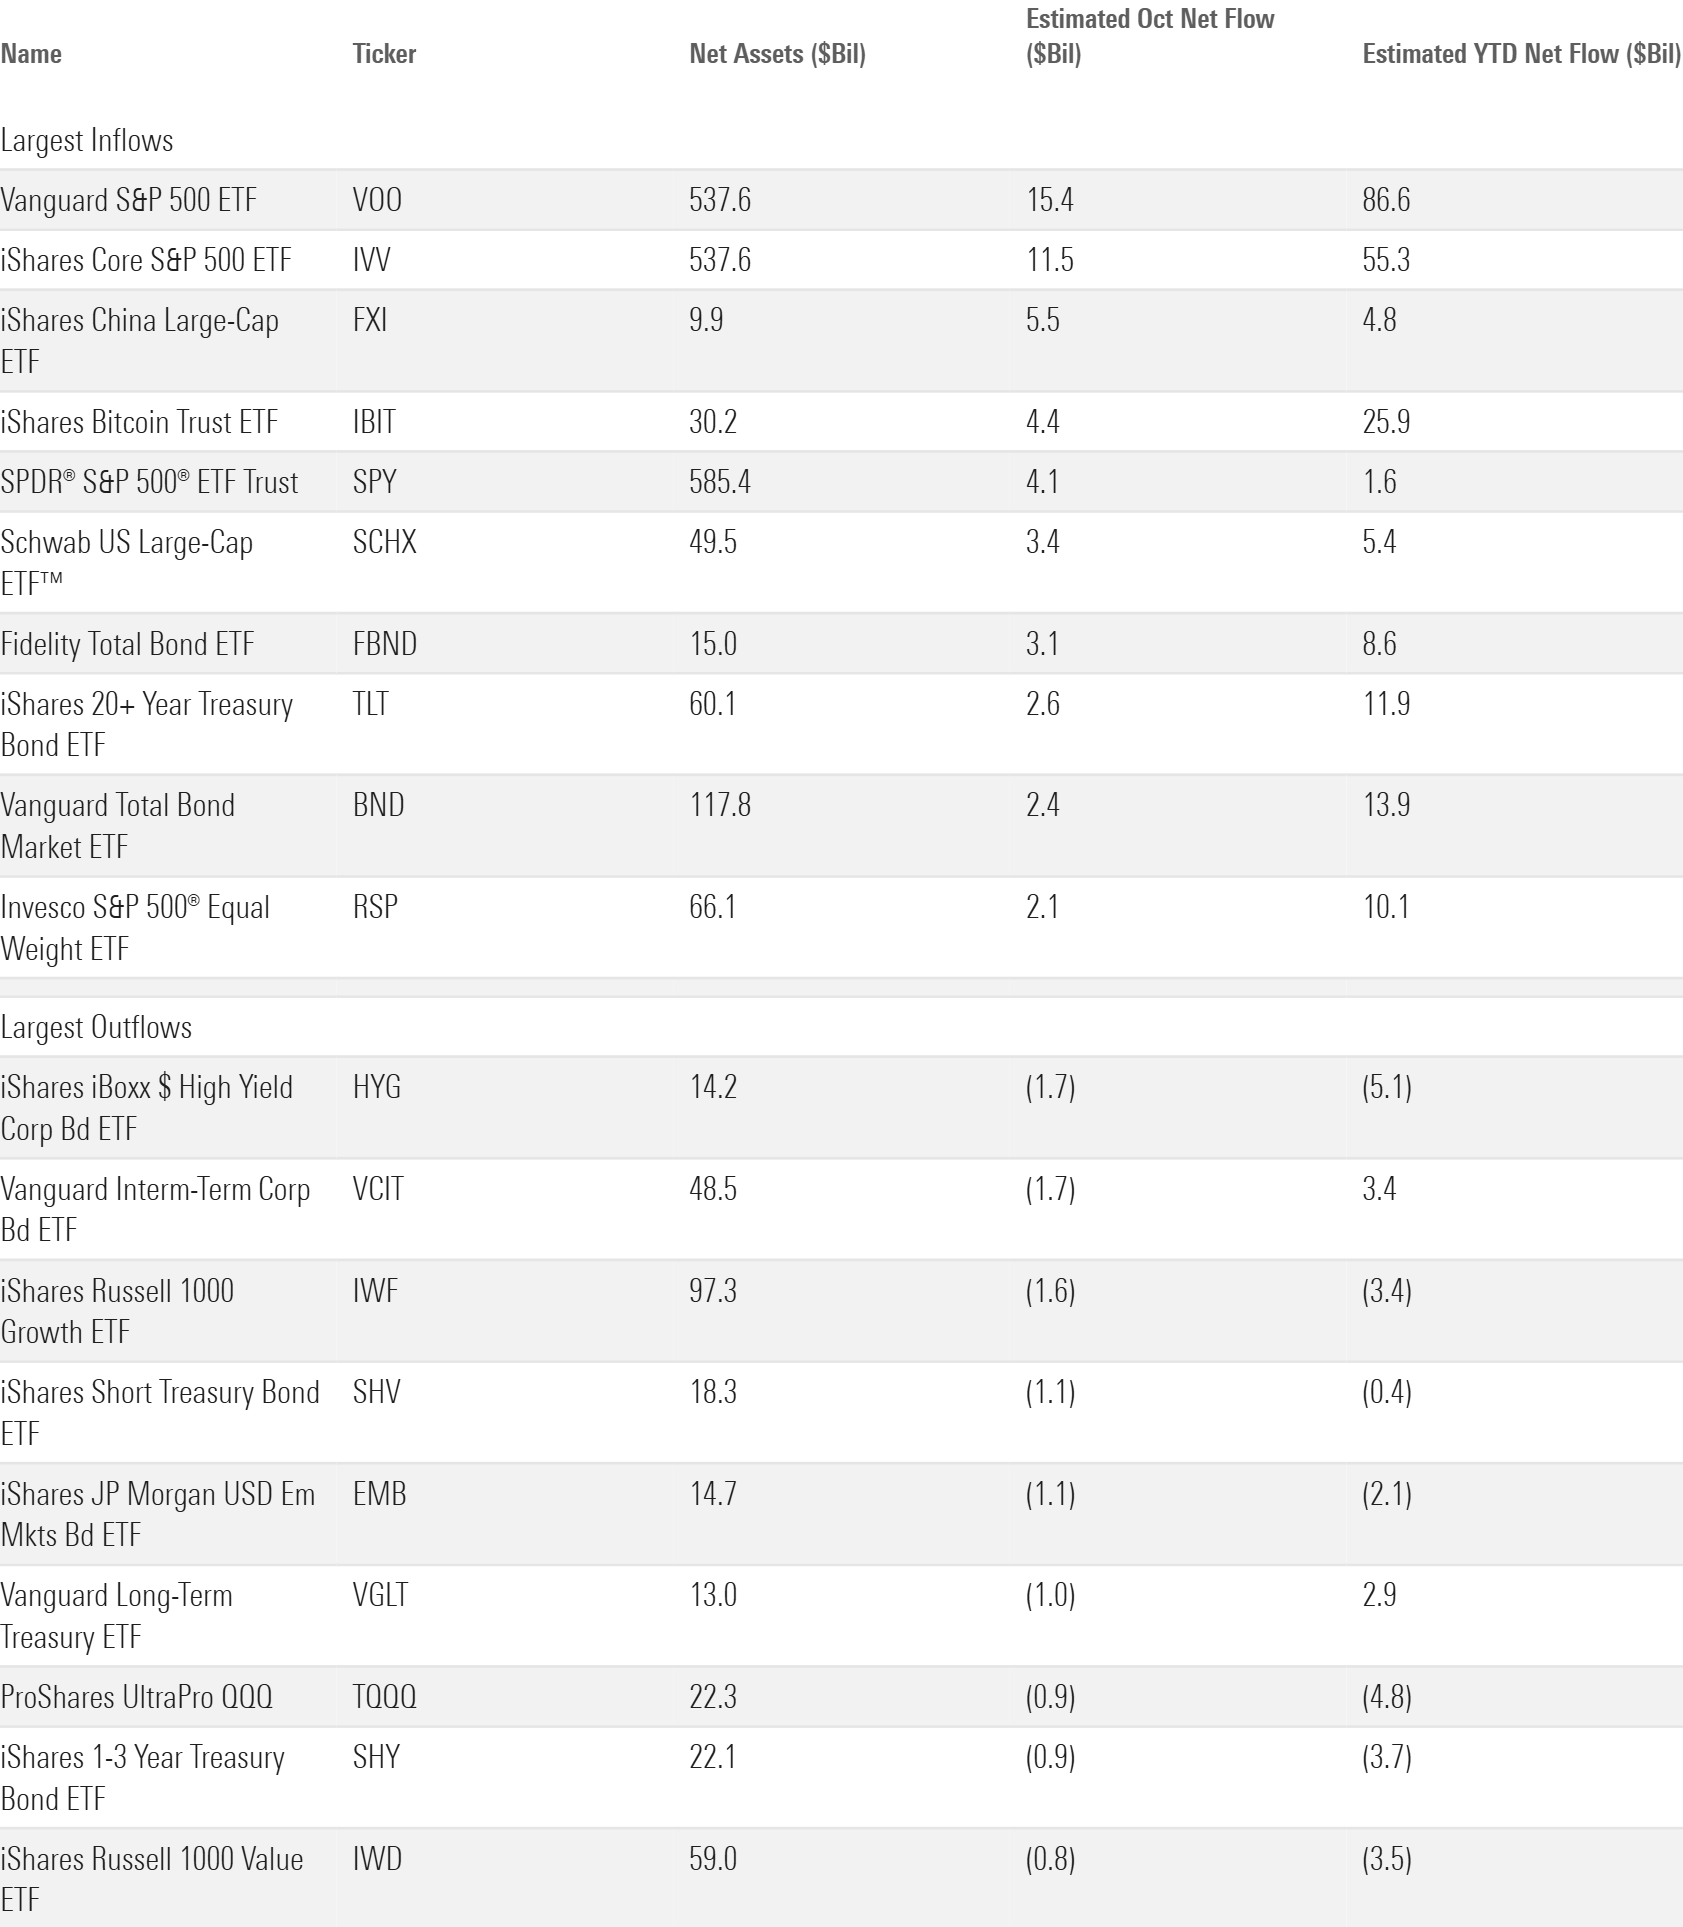
Large-blend index funds have claimed an outsize share of the spoils this year, and none have been in higher demand than Vanguard S&P 500 ETF VOO. It raked in $15 billion in October to lead all ETFs. That narrowly pushed it ahead of iShares Core S&P 500 ETF IVV for the second-largest ETF in the world, despite that IVV’s $12 billion October inflow was certainly nothing to sneeze at. VOO was a mere $22 million larger at the end of October, pennies in the world of hundred-billion-dollar index funds. Next on VOO’s checklist: SPDR S&P 500 ETF Trust SPY, whose $585 billion war chest leads the Vanguard product by nearly $50 billion.
ETFs with the Largest October Flows
Growth funds continued to pull in more money than value in October. So far this year, the large-growth Morningstar Category reeled in $72 billion to the large-value cohort’s $28 billion. Value may have been even further behind without the help of active ETFs. Along the large-, mid-, and small-cap segments, active ETFs consumed about 47% of all net flows into value categories, compared with just 7% of those into growth. Systematic funds from Dimensional and Avantis have pumped those figures on the value side. But some traditional discretionary active funds took root, too, like Capital Group Dividend Value ETF CGDV and its $4.6 billion 2024 haul.
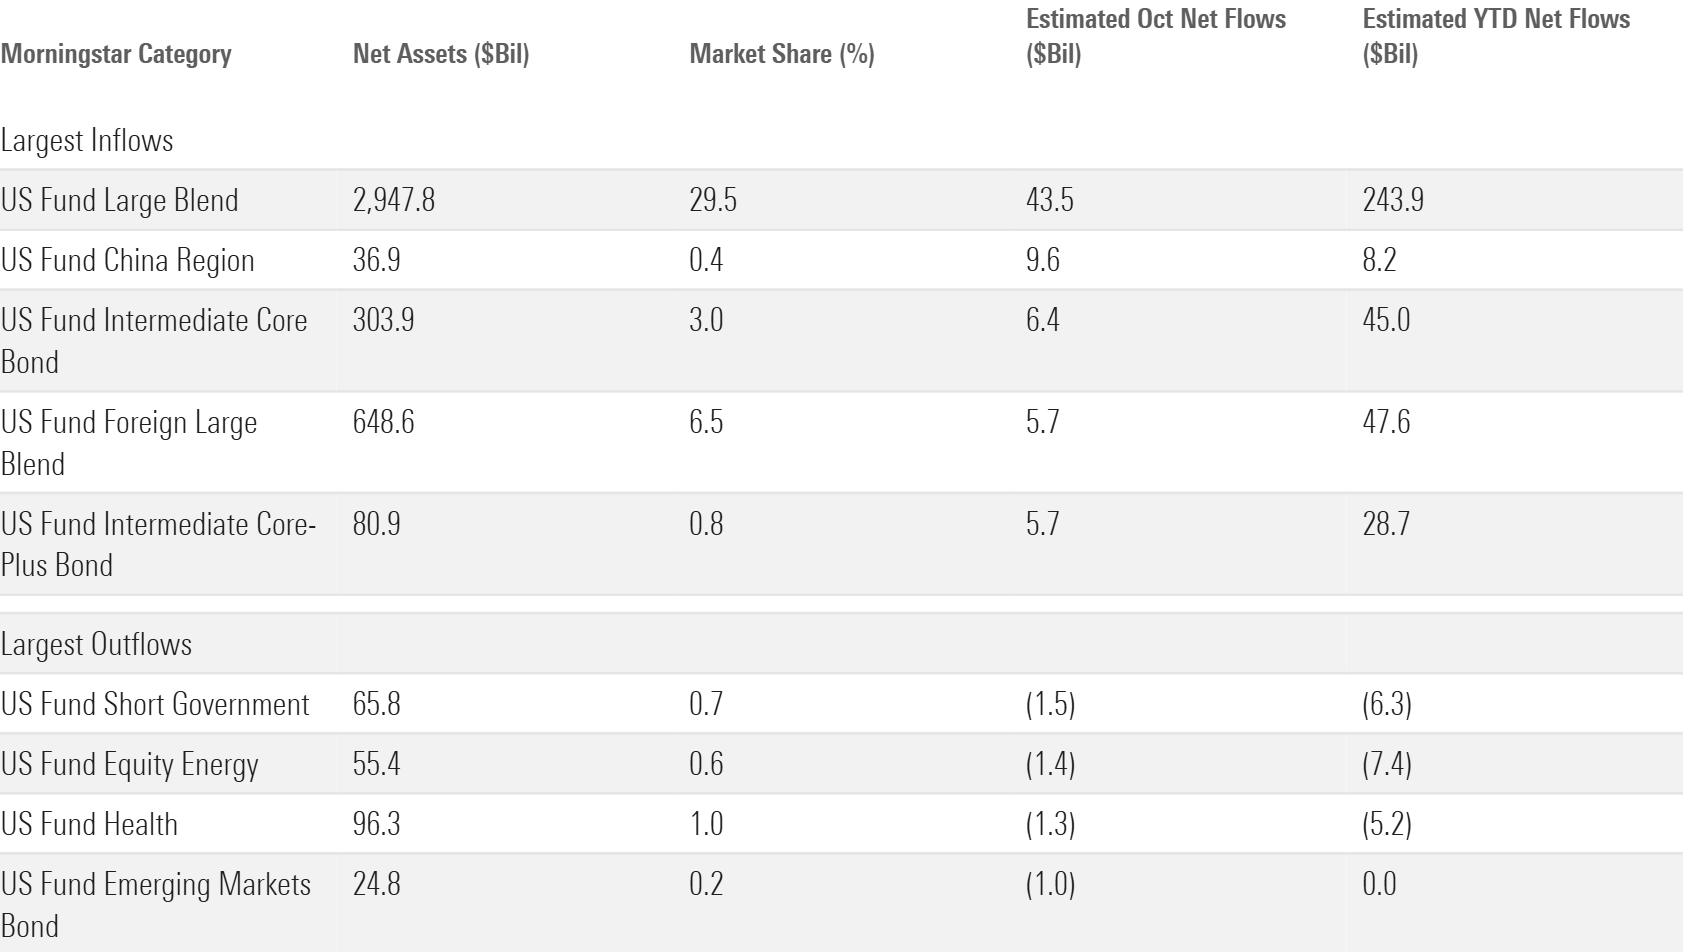
International stock funds broke out with $17 billion of October inflows, their best month since December 2023. The foreign large-blend category had shouldered the load for this cohort all year, but a new standout emerged in October: the China region category.
Investors poured nearly $10 billion into Chinese stock ETFs last month. That more than tripled their previous monthly record and translated to an absurd 35% organic growth rate, or OGR. IShares China Large-Cap ETF FXI benefited the most, raking in roughly $5.5 billion in October. The China region category ballooned to $37 billion in assets from $22 billion over the past two months after a September market rally and the October inflows it ignited.
Morningstar Categories with the Largest October Flows
One foreign stock category’s coming-out party coincided with another’s swan song. The India equity category shed about $350 million in October, ending a streak of inflows that lasted nearly two years and helped its asset base triple to more than $21 billion. Performance could be to blame. IShares MSCI India ETF INDA (which represents more than half the category’s assets) tumbled 6.5% in October. It gained 11.9% for the year to date through October—about 4 percentage points off of iShares MSCI ACWI ETF ACWI.
The derivative-income category pulled in $3.6 billion in October. That technically marked a monthly record, but the 4.1% OGR was a far cry from the monthly figures it generated earlier in the covered-call ETF revolution. JPMorgan Nasdaq Premium Income ETF JEPQ and JPMorgan Equity Premium Income ETF JEPI set the pace with roughly $1 billion and $700 million of inflows, respectively. That said, demand within the derivative-income space has broadened this year. Those J.P. Morgan products absorbed about half the category’s net flows in 2024, down from 74% in 2023. That partly owes to a wider menu of offerings: 39 new derivative-income funds launched since the calendar turned to 2024.
Bond ETF Flows
Investors sank more than $28 billion into taxable-bond ETFs in October. The cohort reeled in $233 billion from January through October 2024, already an annual record. That sum translated into a 16.7% OGR for the year to date, which eclipses the full-year rates for 2022 and 2023.
In October, bond-ETF investors stuck to the script they’ve followed all year. The five categories that led in net flows over the first three quarters formed October’s top five, too. Intermediate core, intermediate core-plus, and ultrashort bond funds led the way with roughly $5 billion to $6 billion of inflows each.
Flows into active taxable-bond ETFs totaled $15 billion in October, exceeding those into index ETFs ($14 billion) for the second month this year. Active intermediate core plus ETFs raked in nearly $5 billion in October, expanding their asset base to $46 billion. Fidelity Total Bond ETF FBND stood out with nearly $3 billion of inflows alone, making it the second-largest active bond ETF (JPMorgan Ultra-Short Income ETF JPST sits comfortably atop that list with $27 billion to its name). The ultrashort bond category—a stronghold for actively managed strategies—notched a nice month as well. It pulled in more than $4 billion behind continued inflows into the $14 billion Janus Henderson AAA CLO ETF JAAA.
Active ETFs have enjoyed a tremendous year of flows. That is especially true when it comes to bond funds. About 36% of bond ETF flows streamed into active products for the year to date through October, compared with 24% for active stock ETFs.
Commodities and Bitcoin ETFs Lend a Hand
Focused commodities ETFs pulled in about $2.4 billion in October. This category, mostly consisting of ETFs that track the price of gold, has enjoyed a run of inflows befitting the precious metal’s tremendous returns. It raked in more than $8 billion over the past four months, a span in which SPDR Gold Shares GLD soared 17.2%. That marked focused commodities ETFs’ best four-month stretch since the start of 2022, when investors flocked to gold amid plummeting stock and bond markets.
The digital assets category raked in nearly $6 billion in October, its most lucrative month since March. More than $4 billion of that streamed into iShares Bitcoin Trust ETF IBIT, whose 35% share of the category makes it the dominant force in cryptocurrency ETFs. Much of the early flows into IBIT and the other spot Bitcoin ETFs that debuted in January came at the expense of Grayscale Bitcoin Trust ETF (BTC) GBTC, which shed nearly $15 billion in the first quarter of 2024. There seems to be little meat left on that bone. GBTC leaked just $65 million in October. That was its mildest monthly outflow of 2024—and a signal that most bitcoin ETF flows will require net new demand from here on out.
ETF Provider Flows
IShares paced all ETF providers with $34 billion of inflows last month. Ten months into the calendar year, its 2024 haul stood at $206 billion, well within striking distance of clubhouse leader Vanguard’s $232 billion tally. Vanguard would clinch its fifth consecutive annual inflows title if iShares can’t close the gap before 2025.
October Flows for the 10 Largest ETF Providers
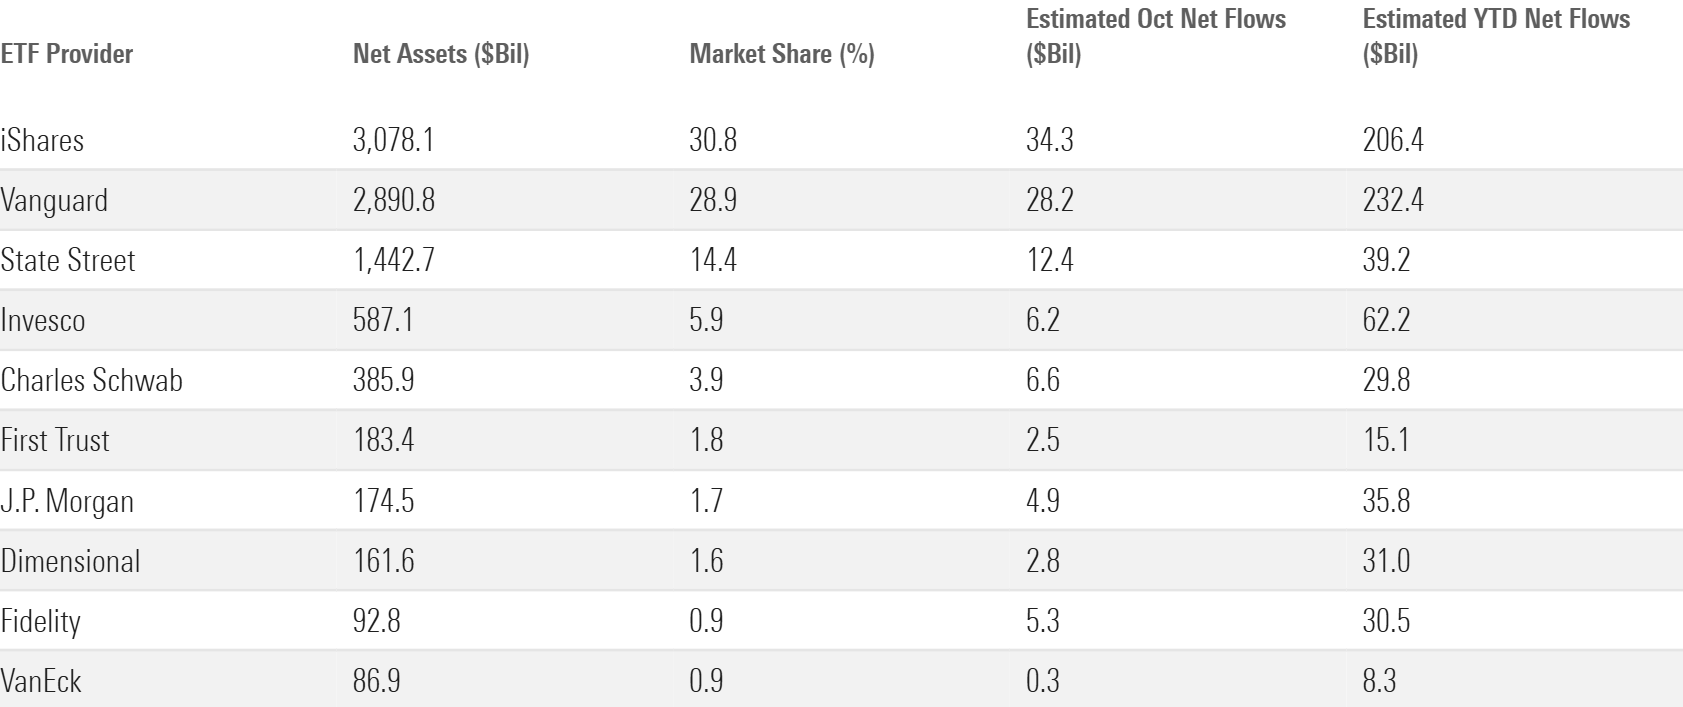
Vanguard is tough to chase down because it dominates the US equity arena, by far the largest of all the category groups. Led by VOO, its US stock ETFs have collectively hauled in more than $150 billion in 2024, more than double iShares (and multiples more than most everyone else). IShares holds an edge in most other segments. Its taxable-bond lineup has generated more inflows than Vanguard’s this year, $81 billion to $49 billion. IBIT has given iShares’ alternatives cohort a decisive advantage. And its foreign stock ETF menu holds a narrow edge. Still, the sheer scale of Vanguard’s US equity funds—and the discipline of its investor base to buy and hold them—will probably push it to the top once again in 2024.
Where Can Investors Find Value?
The fair value estimate for ETFs rolls up our equity analysts’ fair value estimates for individual stocks and our quantitative fair value estimates for stocks not covered by Morningstar analysts into an aggregate fair value estimate for stock ETF portfolios. Dividing an ETF’s market price by this value yields its price/fair value ratio. This ratio can point to potential bargains and areas of the market where valuations are stretched.
The 10 Most Under- and Overvalued Analyst-Rated ETFs
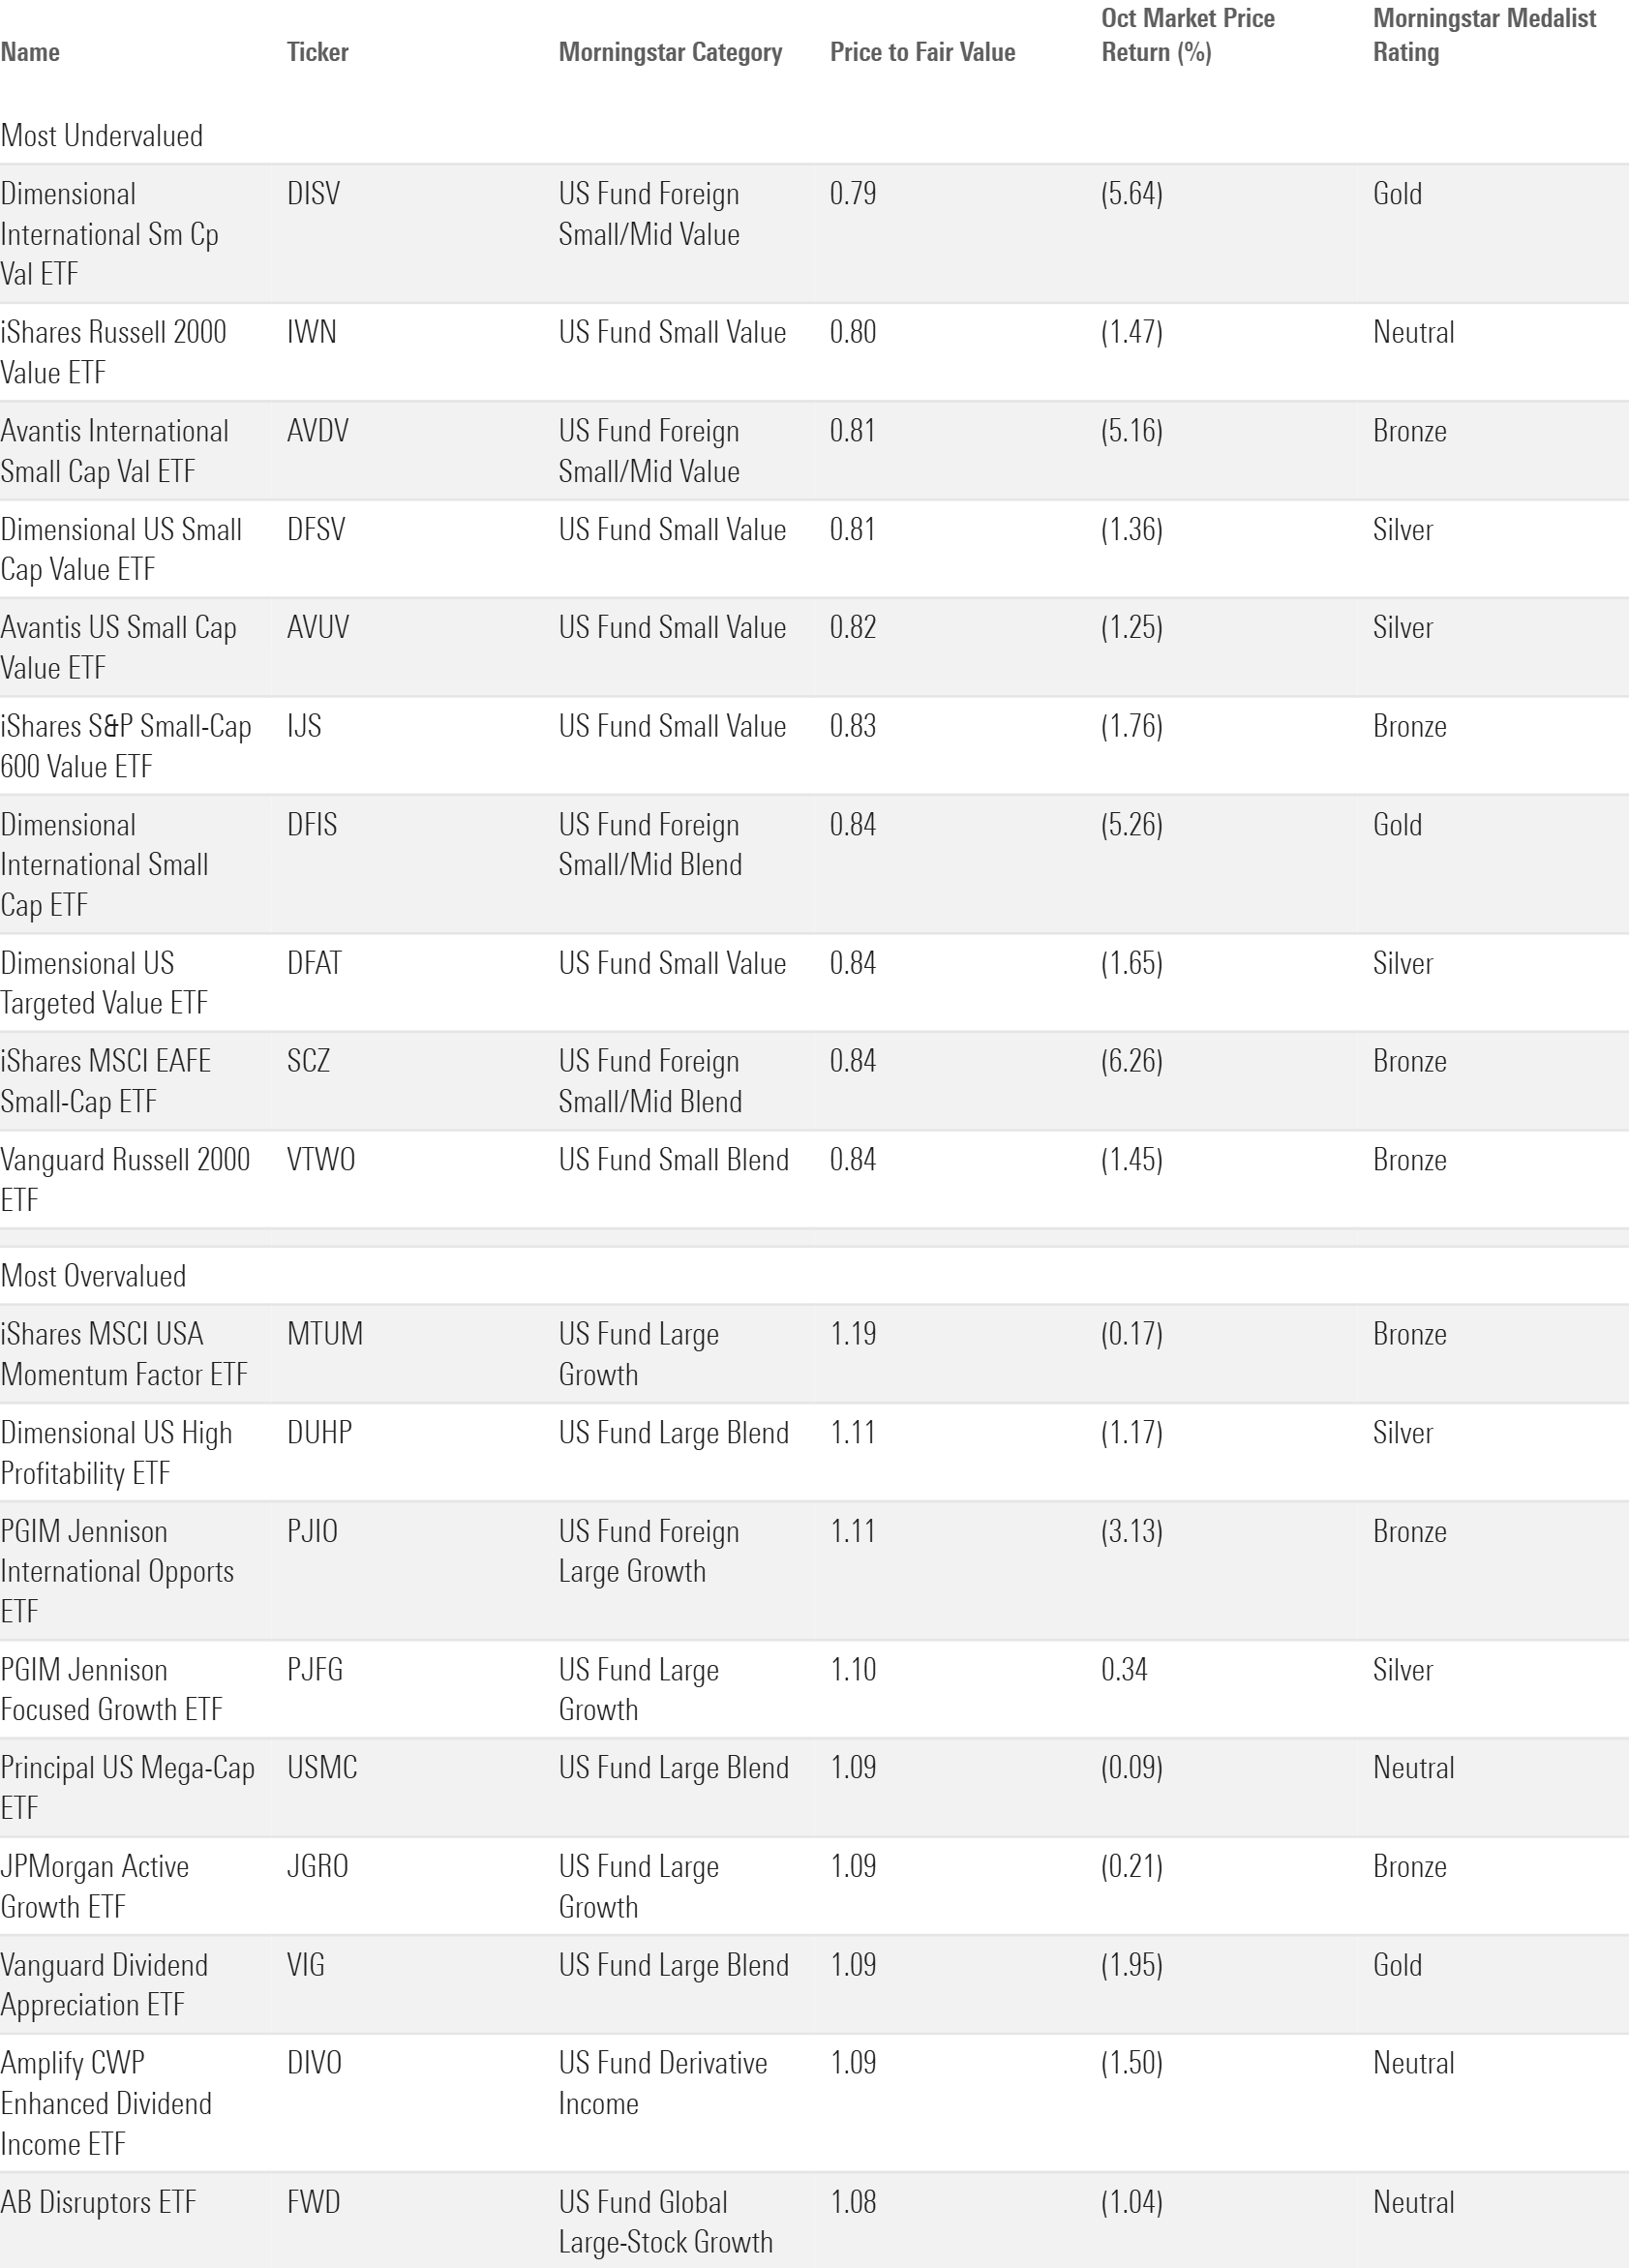
Morningstar recently published its US stock market outlook for November 2024, drawing on the same fundamental research that underpins the price/fair value estimate. The article circles the small-value category as the most undervalued corner of the market. Several of the funds on the cheaper half of Exhibit 6 fit that description, whether they invest overseas or stateside.
The author or authors do not own shares in any securities mentioned in this article. Find out about Morningstar’s editorial policies.

 United States