
ETFs Shatter Monthly and Annual Inflow Records in November
Exchange-traded funds raked in a record $161 billion in November.


This article mentions funds that have an issuer-initiated rating and/or track a Morningstar Index. For full disclosure information, please refer to the specific funds, which are demarcated with a * symbol, listed below.
Key Takeaways
- The Morningstar Global Markets Index, a broad gauge of global equities, advanced 3.8% behind stellar US stock market performance.
- The Morningstar US Core Bond Index rallied late in November 2024 to secure a 1% gain.
- US exchange-traded funds raked in a record $161 billion in November.
- Investors have poured more than $980 billion into ETFs in 2024, well past the $900 billion annual flows record set in 2021.
Bond Market Summary
Exhibit 1 shows the November 2024 performance for a sample of analyst-rated ETFs that cover major sections of the stock and bond markets. A blended global portfolio climbed 3% last month as all three of its components finished November higher than where they started.
November Market Performance Through the Lens of Analyst-Rated ETFs
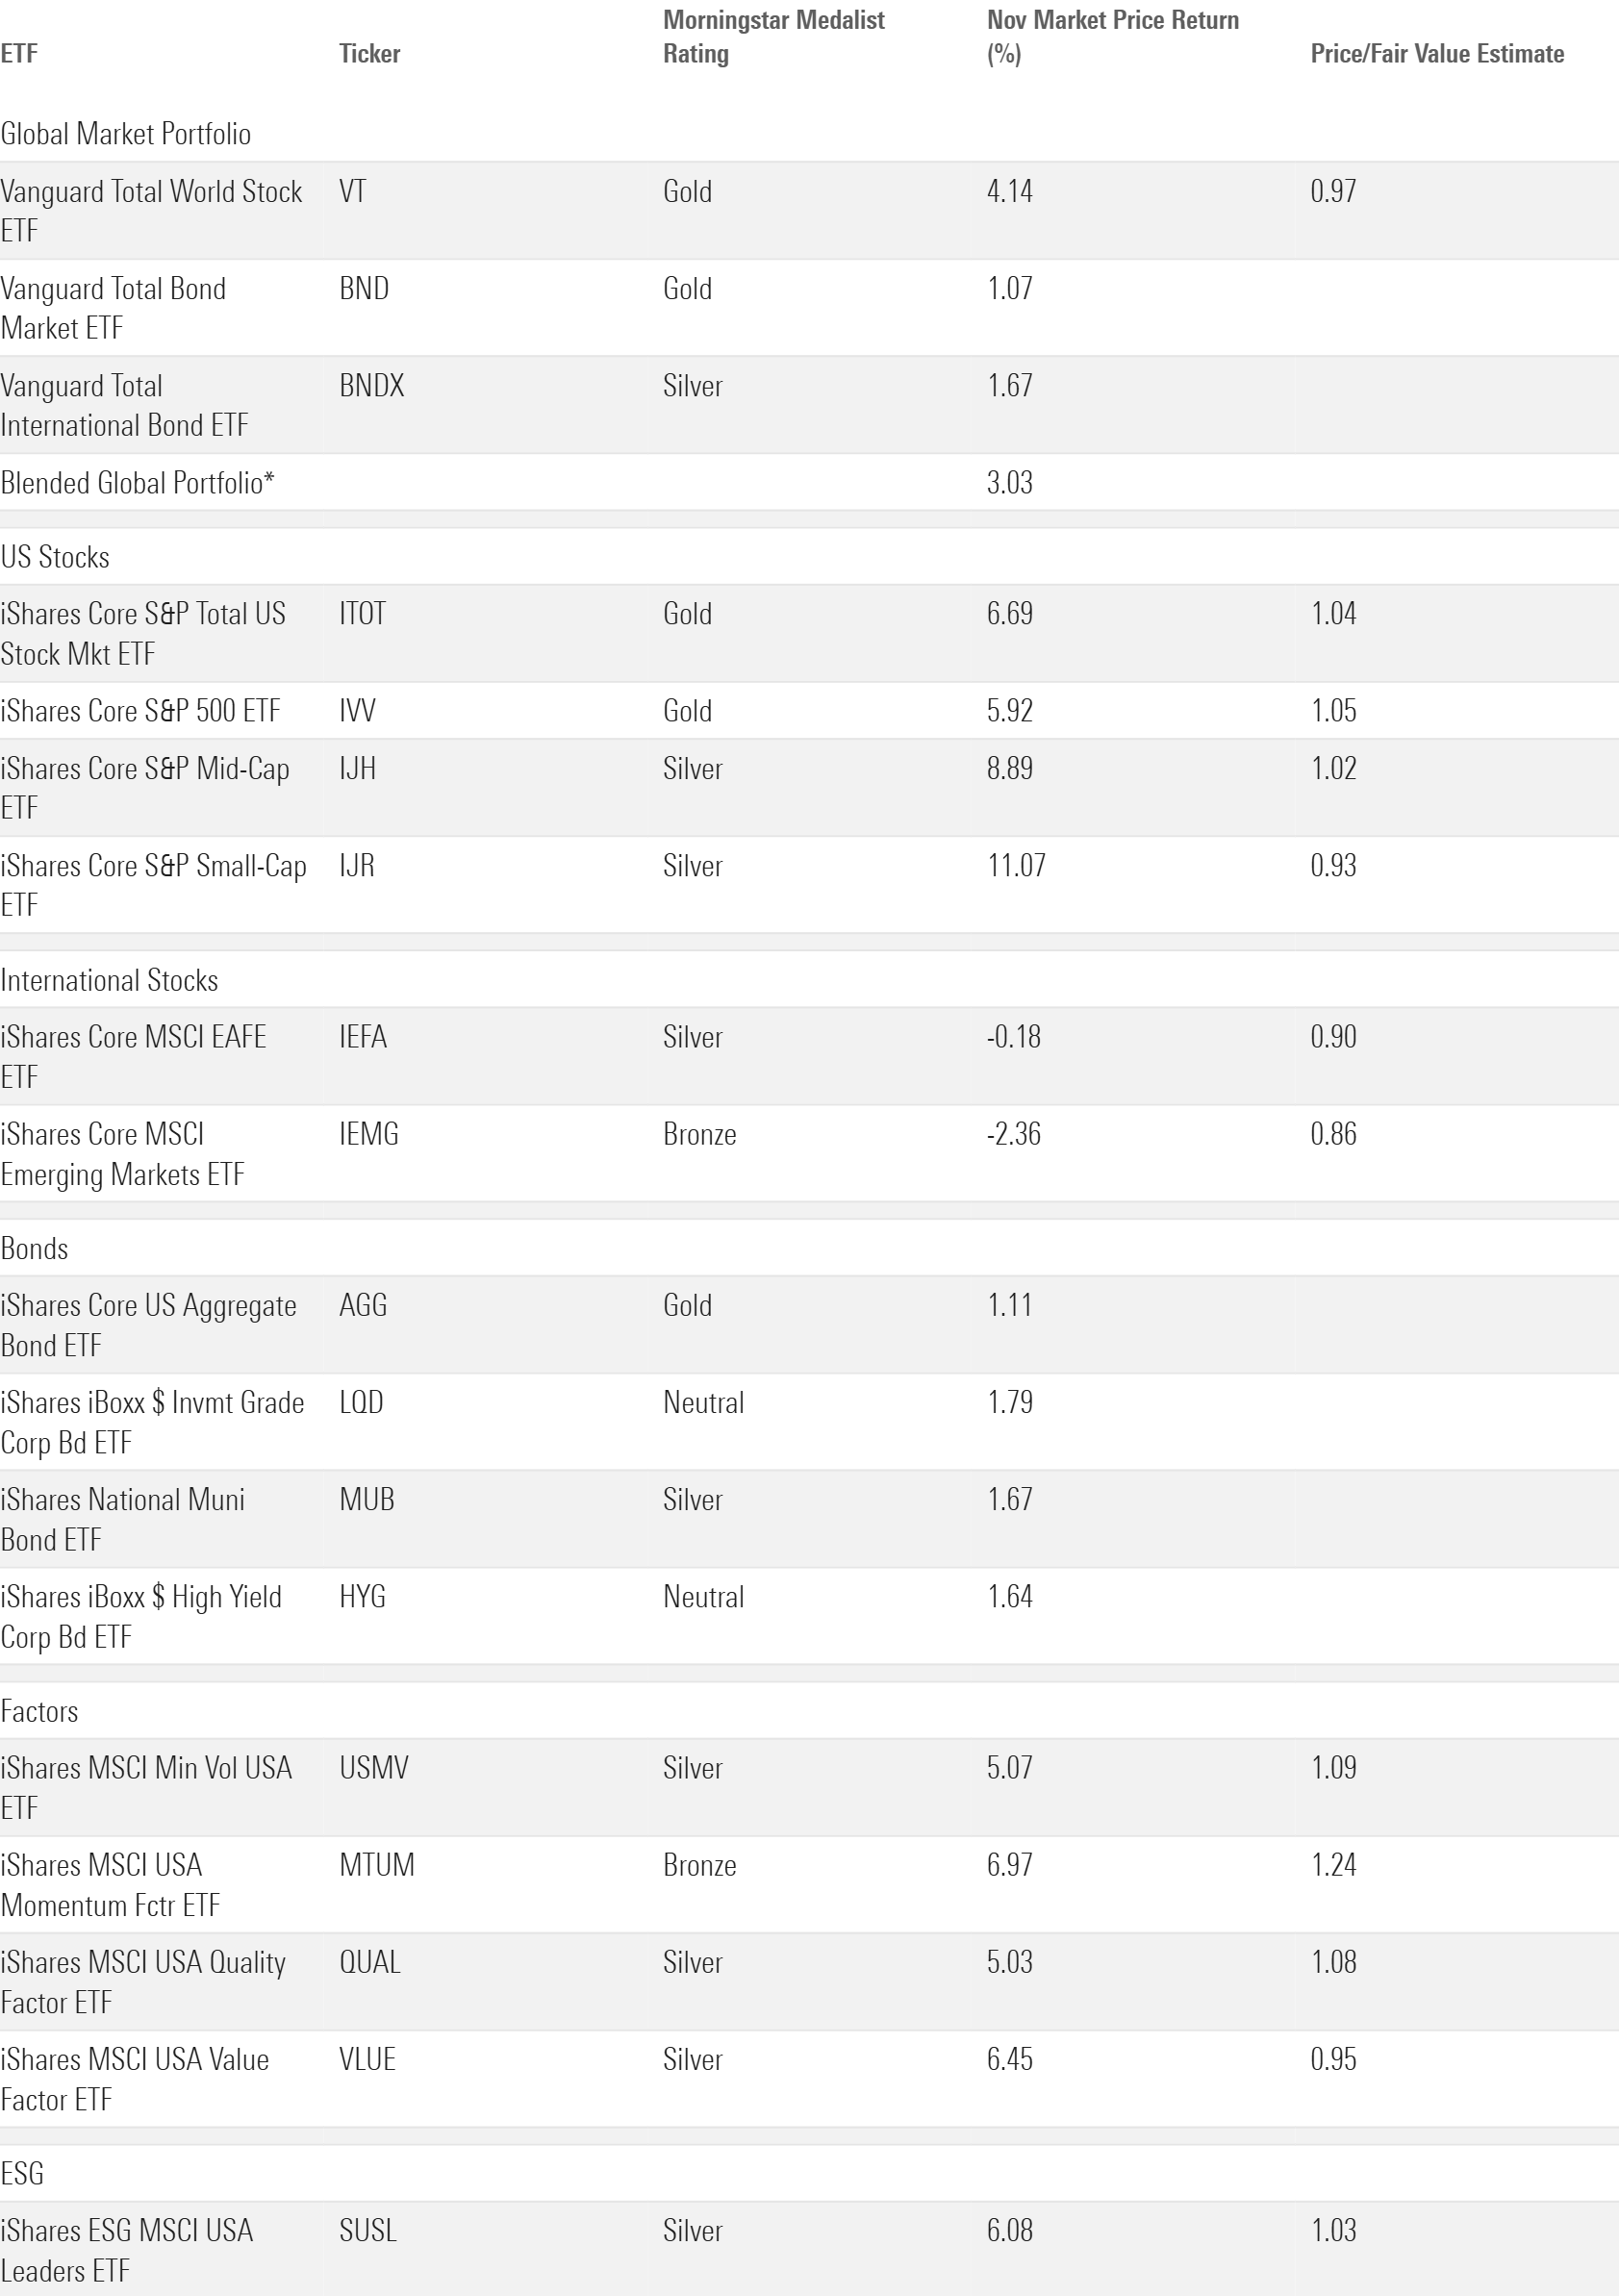
Several asset classes rallied after Donald Trump clinched the presidential election on the night of Nov. 5. Bonds were not one of them. Investors broadly sold off Treasuries, believing that President-elect Trump’s tariff- and tax-cut-heavy agenda could increase the national deficit and reignite inflation. IShares US Treasury Bond ETF GOVT slid about 0.8% the day after the election. IShares US Treasury Bond 20+ Year ETF TLT, which is more sensitive to fluctuations in interest rates, spiraled 2.7% on the same day.
The bond market eventually turned around. Treasury Secretary nominee Scott Bessent may deserve the credit. Treasuries immediately rallied after Trump announced his choice for the position—a vote of confidence that the former hedge fund manager would keep inflation in check. GOVT climbed 1.4% in the days following the announcement and finished the month with a 0.8% gain.
Corporate bonds followed a similar trajectory as their government peers in November. Narrowing credit spreads provided an extra boost. IShares Broad USD Investment Grade Corporate Bond ETF USIG advanced 1.5% on the month, close behind SPDR Bloomberg High Yield Bond ETF’s JNK 1.6% gain. The same enthusiasm that powered stocks to an excellent month played a role here.
Stock Market Summary
“Trump bump,” “relief rally,” or whatever moniker you prefer, US stocks excelled on the heels of the election. Promises of deregulation and corporation-friendly tax policies that accompanied the Republican victory excited investors. Vanguard Total Stock Market ETF
VTI
Small-cap stocks benefited most acutely. IShares Core S&P Small-Cap ETF IJR advanced 11.1% in November, outpacing iShares Core S&P 500 ETF’s IVV 5.9% gain. Small-cap funds tend to be more sensitive to changes in the economy and regulatory environment. They also generate a higher percentage of their revenue in the US than multinational mega-caps. IJR derived 81% of its revenue from the US as of November 2024 compared with just 60% for IVV, according to Morningstar’s revenue exposure tool. Trump’s guarantees to raise tariffs on imported goods could insulate small-cap companies from the costs that are soon to face global competitors.
All of State Street’s sector ETFs posted gains in November. The Consumer Discretionary Select Sector SPDR ETF XLY set the pace with a 12.9% gain. It entered November with nearly a 15% stake in Tesla TSLA, which turbocharged the fund with its 38% return on the month. The Financial Select Sector SPDR ETF XLF gained 10.5% in November. That pushed its return to 45.3% on the year—tops in the SPDR sector suite.
November crystallized many of the trends between sectors and investing styles that have taken shape throughout the year. That was the perfect recipe for momentum strategies to stay on fire. IShares MSCI USA Momentum Factor ETF MTUM cruised to a 7% November return. It finished in the bottom 1% of all large-growth funds in 2023 but rocketed 38.6% for the year through November, ranking among the top 2% of the same peer group. Not to be outdone, rival Invesco S&P 500 Momentum ETF SPMO gained 48.3% this year. Consistent market regimes are the ideal backdrop for the momentum factor, and the funds that target it have capitalized. And now they command a premium. MTUM and SPMO traded 24% and 16% above their fair value as of November 2024, according to Morningstar’s price/fair value estimate.
ETF Flows
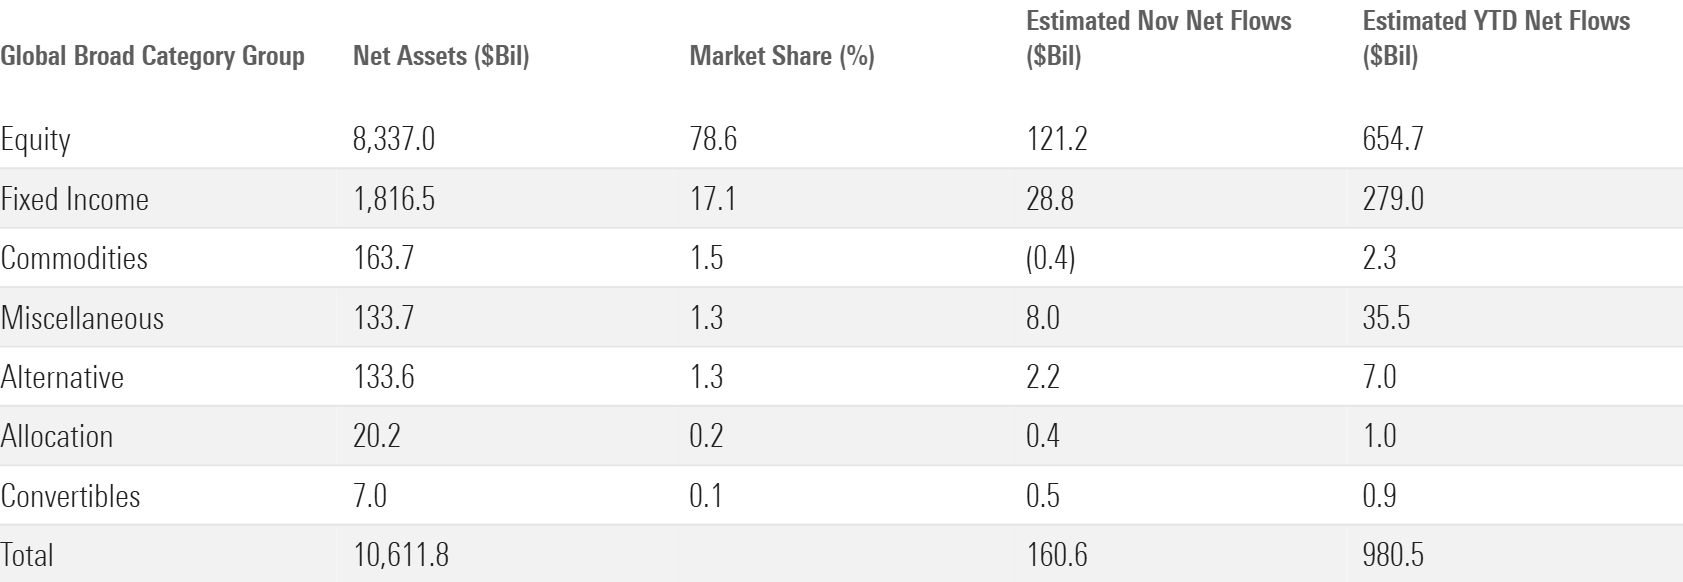
Investors piled nearly $161 billion into US-domiciled ETFs in November, a monthly record. That translated into a 1.56% organic growth rate—a strong figure, to be sure, but one that has been exceeded four times since the start of 2020.
Market performance and fund flows are often tied at the hip. November was no exception. Several of the hottest corners of the market doubled as hosts to the most popular ETFs. Seasonality may have been a factor, too. November ranked as the second-best month for ETF flows from 2008 through 2023, behind December.
US ETFs have now reeled in roughly $980 billion of new money on the year, blowing past the $900 billion record from 2021 with a month to spare. It would be a shock if ETFs did not eclipse the $1 trillion mark by the time 2024 concludes.
November Flows Across Morningstar Broad Category Groups
Stock ETF Flows
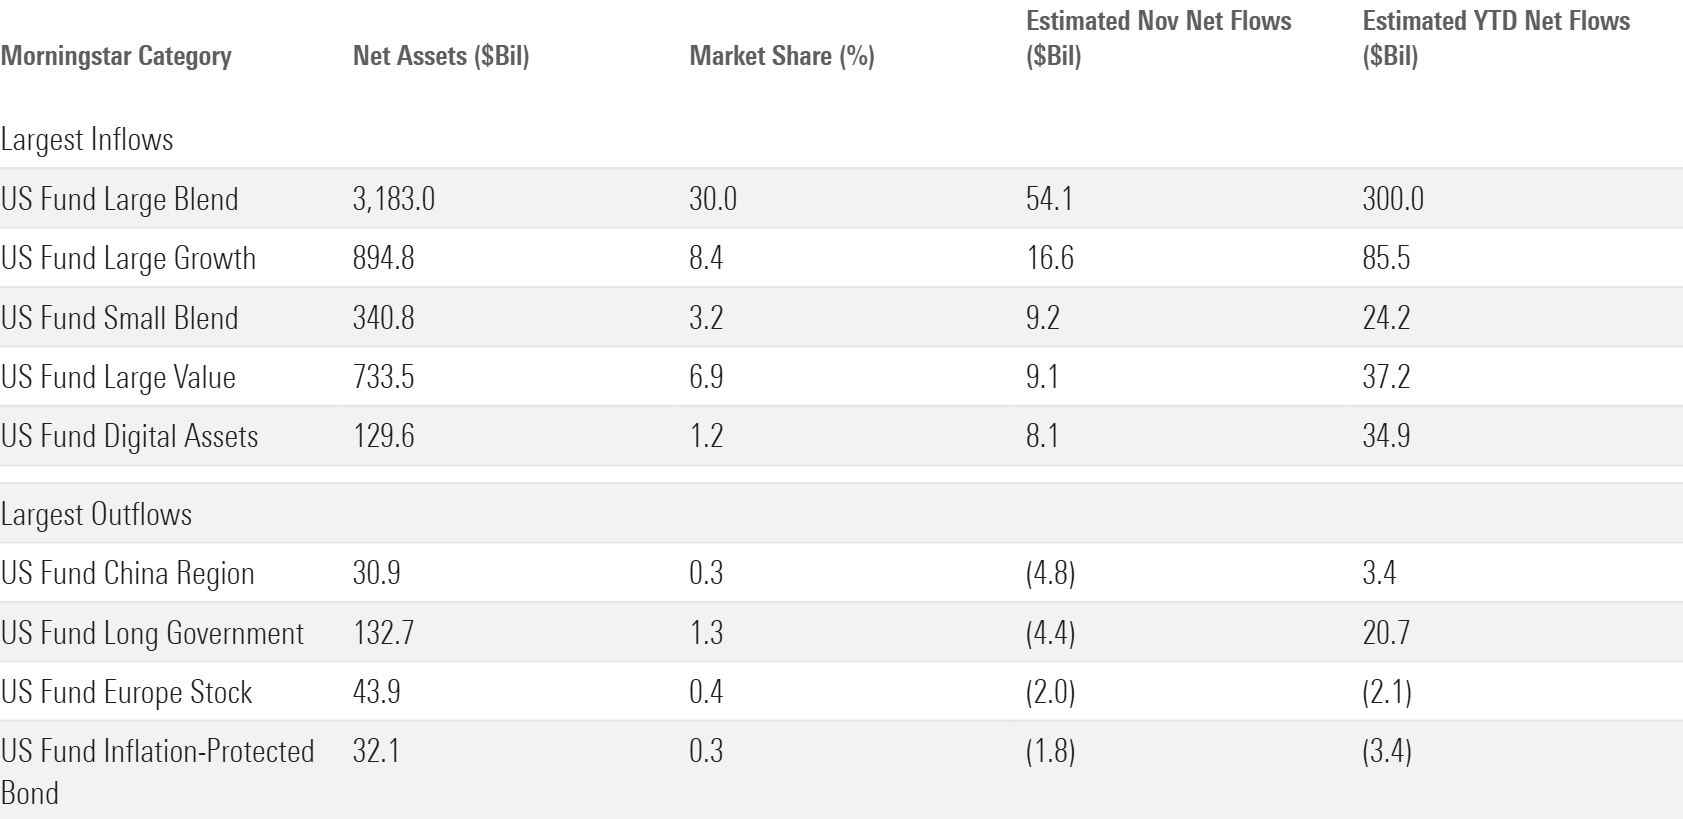
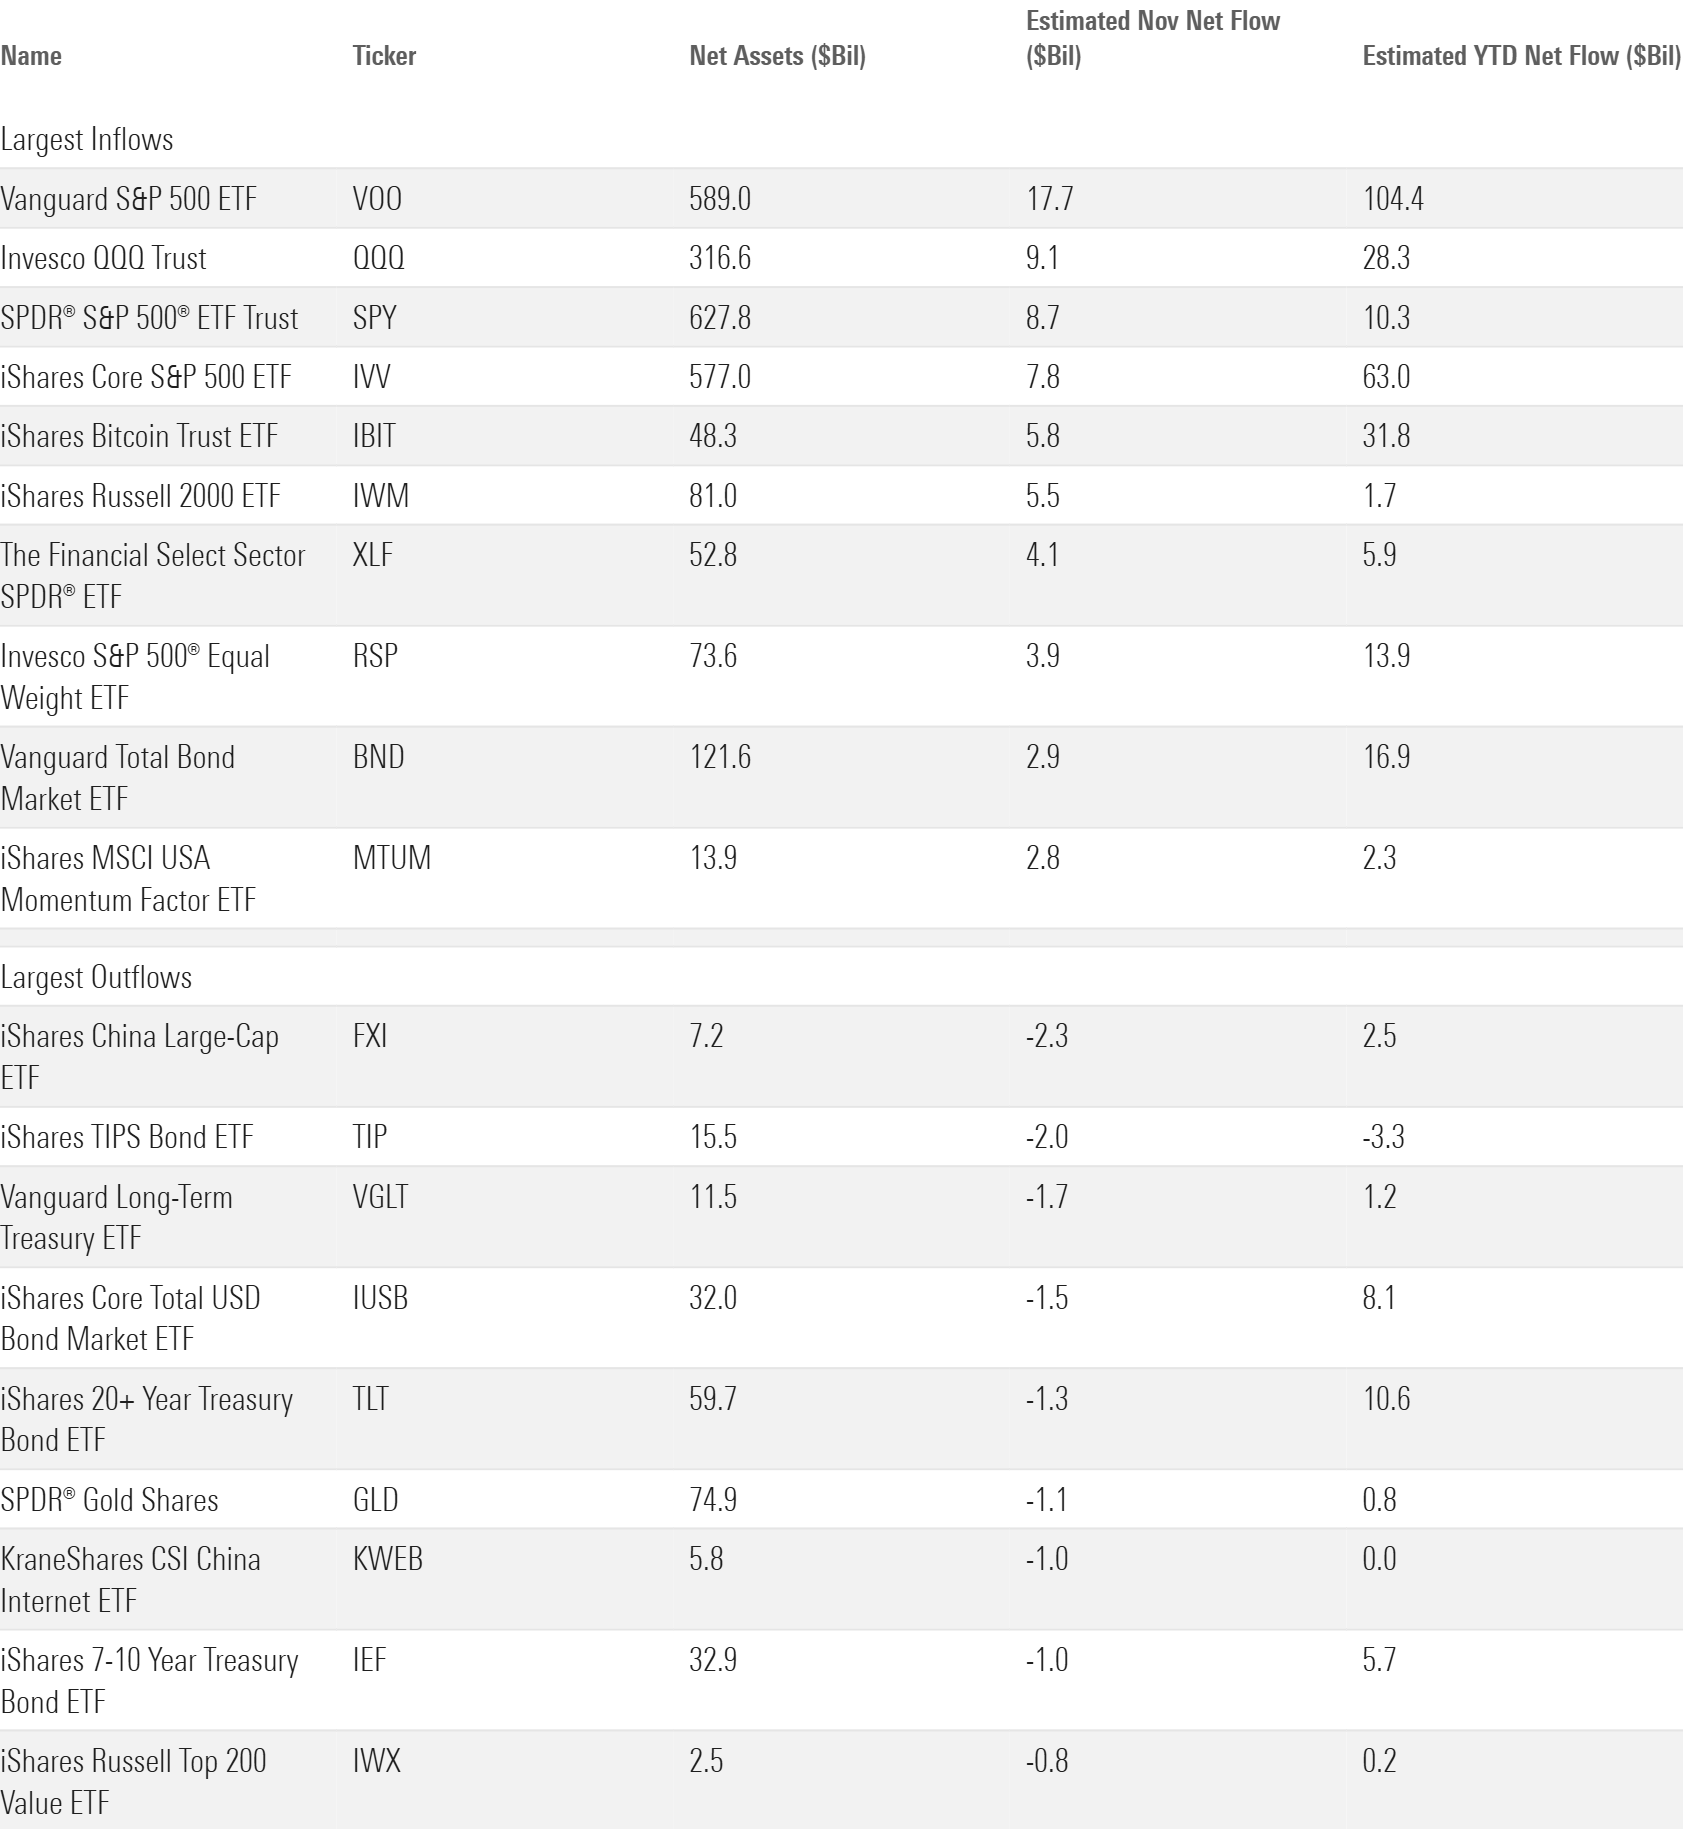
US equity funds hauled in $97 billion in November, clearing the previous record of $84 billion set in December 2023. Large-blend funds stayed on a roll. The category constitutes roughly 30% of the ETF market yet still managed to punch above its weight, accounting for roughly one third of all November net flows. Vanguard S&P 500 ETF VOO continues to outdo itself. The broad index tracker reeled in $18 billion during the month to push its 2024 total to $104 billion—more than double the previous annual inflow record of $51 billion.
Large-growth and mid-cap blend funds also fueled the strong month for US stock ETFs. November brought record flows into each of those Morningstar Categories. The large-growth space collected nearly $17 billion, including more than $10 billion that rushed into Invesco QQQ Trust QQQ and its smaller counterpart Invesco Nasdaq 100 ETF QQQM. Those ETFs helped their category absorb $86 billion in 2024, well ahead of large value’s $37 billion intake.
Plain-vanilla index trackers headlined the mid-cap blend category’s $7 billion of inflows. IShares Core S&P Mid-Cap ETF IJH and iShares Russell Mid-Cap ETF IWR each gathered over $1 billion. The breakout, however, was Invesco S&P MidCap Momentum ETF XMMO. After more than $1 billion of inflows and a gaudy 11.5% return, the fund exited November almost twice the size as when it entered it.
ETFs that target individual sectors enjoyed healthy inflows. Investors piled $14 billion into the sector-equity cohort, the most since February 2021. Cyclical sectors ruled the roost. Financial ETFs collected nearly $8 billion to lead the pack, followed by technology ($4 billion inflow), industrials, and consumer cyclical (nearly $2 billion apiece). Meanwhile, defensive sector-equity categories saw their investors head for the exits. ETFs that track the healthcare, consumer defensive, and utilities sectors all suffered outflows in November.
International-equity funds didn’t join the fun and finished November roughly flat. Foreign and global large-blend funds welcomed their customary inflows, but investors soured on several region- or country-specific segments. The China region category suffered $5 billion of outflows—a crushing letdown after its record $9 billion haul in October. India-equity and Japan-stock funds, breakouts in 2023 and early 2024, each endured outflows. Ditto the Europe-stock and Pacific/Asia ex-Japan stock categories. Tepid flows into international-stock funds have signaled that investors may be growing weary of the performance gap between foreign and US stocks—a trend the presidential election result only exacerbated.
Morningstar Categories With the Largest November Flows
Bond ETF Flows
Investors gravitated toward credit-oriented bond categories in November. High-yield bond funds raked in roughly $3 billion. That marked their seventh consecutive month of inflows, a monthly streak the category last matched in 2012. Bank-loan funds gathered about $3 billion as well. Narrowing credit spreads and inflation concerns created a nice backdrop for these funds, which normally come with high default risk but hardly any duration. Investors plowed more than $9 billion into bank-loan ETFs on the year—good for a 62% organic growth rate.
Treasury ETFs caught the wrong edge of the pro-credit sword. Flows into the small-, intermediate-, and long-term government categories were roughly flat on the month. That marked the cohort’s quietest month since January 2022. The outflows came from the long-term segment, where three separate ETFs bled more than $1 billion.
Investors that wanted safety opted for cashlike ultrashort bond funds instead of Treasuries. Ultrashort bond led all fixed-income categories with $7 billion of November inflows and has now raked in $41 billion on the year. Actively managed funds spearheaded the growth. Roughly $30 billion streamed into active ultrashort bond funds in 2024, second only to active large-blend funds across all Morningstar Categories.
ETFs With the Largest November Flows
Quick Hits
- Actively managed ETFs pulled in about $38 billion in November, a fresh monthly record. They have gathered $257 billion since the start of 2024, more than doubling the previous annual record from 2023. The drumbeat grows.
- Few investments benefited more from the election results than bitcoin and the ETFs that track its price. IShares Bitcoin Trust ETF IBIT soared 38.4% in November. Investors noticed, sinking nearly $6 billion into the fund and a record $8 billion into the digital-assets category.
- Sustainable ETFs ironically collected more than $1 billion in November. After failing to crack the $1 billion monthly mark since February, sustainable ETFs have done it back-to-back. Still, these funds are far removed from their prime. In 2020-21, sustainable ETFs exceeded $1 billion of inflows in all but two months and racked up more than $75 billion over that span.
- Momentum funds saw inflows commensurate with their returns in November, gathering roughly $6 billion in the month. The lion’s share went to three ETFs: IShares MSCI USA Momentum Factor ETF, Invesco S&P MidCap Momentum ETF, and Invesco S&P 500 Momentum ETF. BlackRock’s model portfolios may have bolstered the iShares fund’s flows, but it’s unclear whether the Invesco products generated more grassroots demand.
- The derivative-income category, home to covered-call behemoths JPMorgan Equity Premium Income ETF JEPI and JPMorgan Nasdaq Equity Premium Income ETF JEPQ, scored more than $3 billion of inflows in November. That marks two straight months it has cleared that threshold.
ETF Provider Flows
IShares raked in $38 billion to lead all ETF providers in November net flows. That was somewhat of a surprise considering its taxable-bond lineup—a valuable growth engine of late—collected a mild $5 billion, its lowest total since April. Popular core index trackers like iShares Core S&P 500 ETF and iShares Russell 2000 ETF IWM helped it win the month.
Vanguard holds a $20 billion lead over iShares in the 2024 flows title race. We will detail the final results in the year-end version of this article next month.
November Flows for the 10 Largest ETF Providers
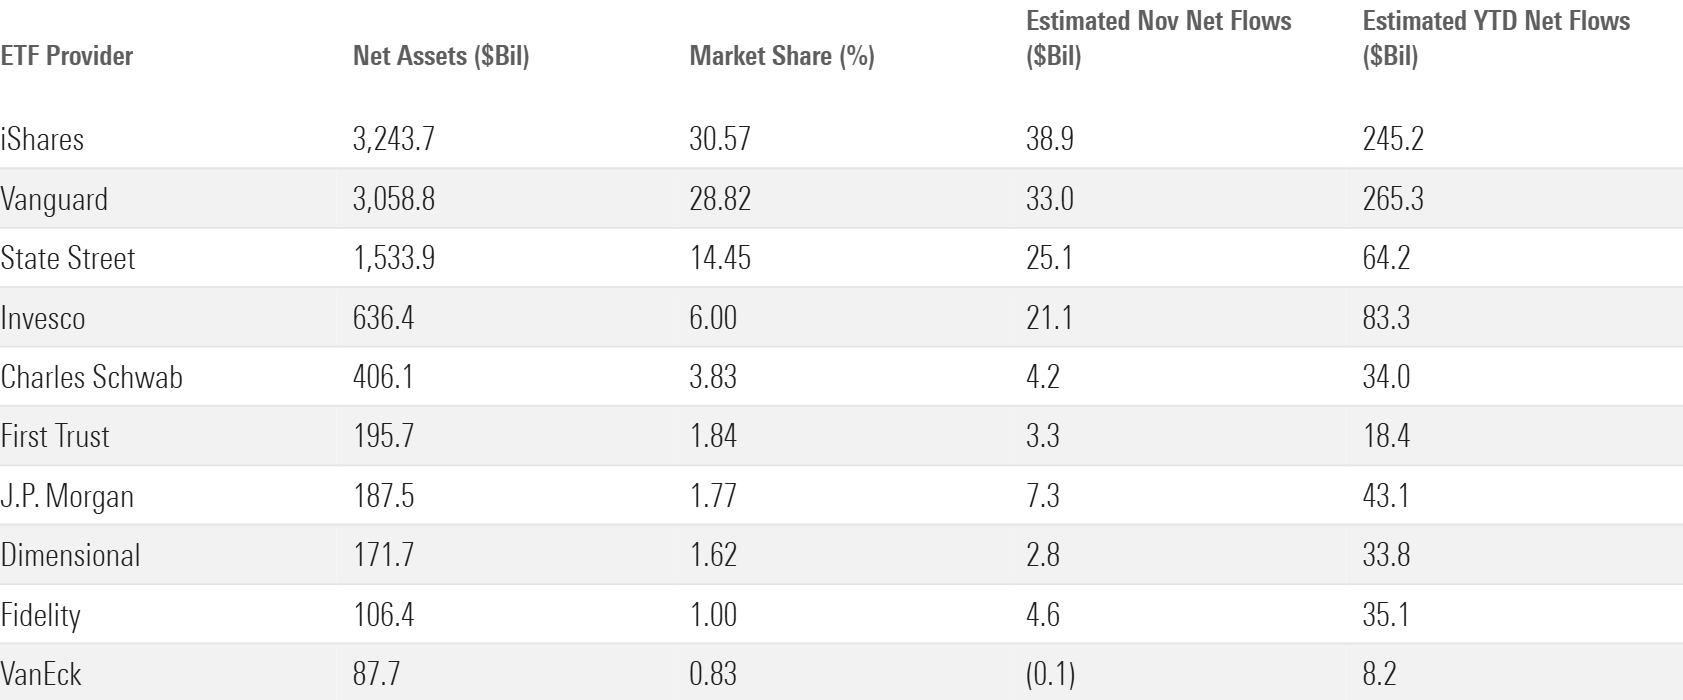
Invesco ETF flows won’t measure up to those of iShares or Vanguard, but the fund provider has enjoyed a banner year all the same. It absorbed $21 billion in November, shattering its previous monthly record of $14 billion. Invesco has gathered $83 billion so far in 2024 to cruise past its previous annual record of $55 billion.
Two main ingredients constitute Invesco’s secret sauce: the Nasdaq-100 Index and strategic beta. QQQ and QQQM have jointly corralled north of $41 billion on the year, nearly half of all flows into Invesco ETFs. QQQ is undoubtedly the shop’s crown jewel. Launched in 1999, it today serves as a shorthand instrument for liquid tech exposure as well as a buy-and-hold investment. That rarefied status commands immense (if occasionally volatile) flows.
The rise of active ETFs has come partially at the expense of strategic beta, index funds that track non-cap-weighted or otherwise nontraditional benchmarks. Invesco has managed to buck the trend in 2024. Invesco S&P 500 Equal Weight ETF RSP has led the charge here. The mascot of the “market broadening” many investors hoped to see in 2024 has excelled even as major stock indexes became further concentrated. RSP has racked up $14 billion for the year. Concerning factors, Invesco’s suite of quality and momentum products collected about $7 billion apiece in the year.
Invesco hasn’t staged a clean sweep of the strategic-beta space. Its low-volatility and multifactor ETFs have faced outflows amid thickening competition. Still, this recently overlooked segment of the ETF universe has been key to Invesco’s campaign.
Where Is the Value?
The fair value estimate for ETFs rolls up our equity analysts’ fair value estimates for individual stocks and our quantitative fair value estimates for stocks not covered by Morningstar analysts into an aggregate fair value estimate for stock ETF portfolios. Dividing an ETF’s market price by this value yields its price/fair value ratio. This ratio can point to potential bargains and areas of the market where valuations are stretched.
The 10 Most Over- and Undervalued Analyst-Rated ETFs
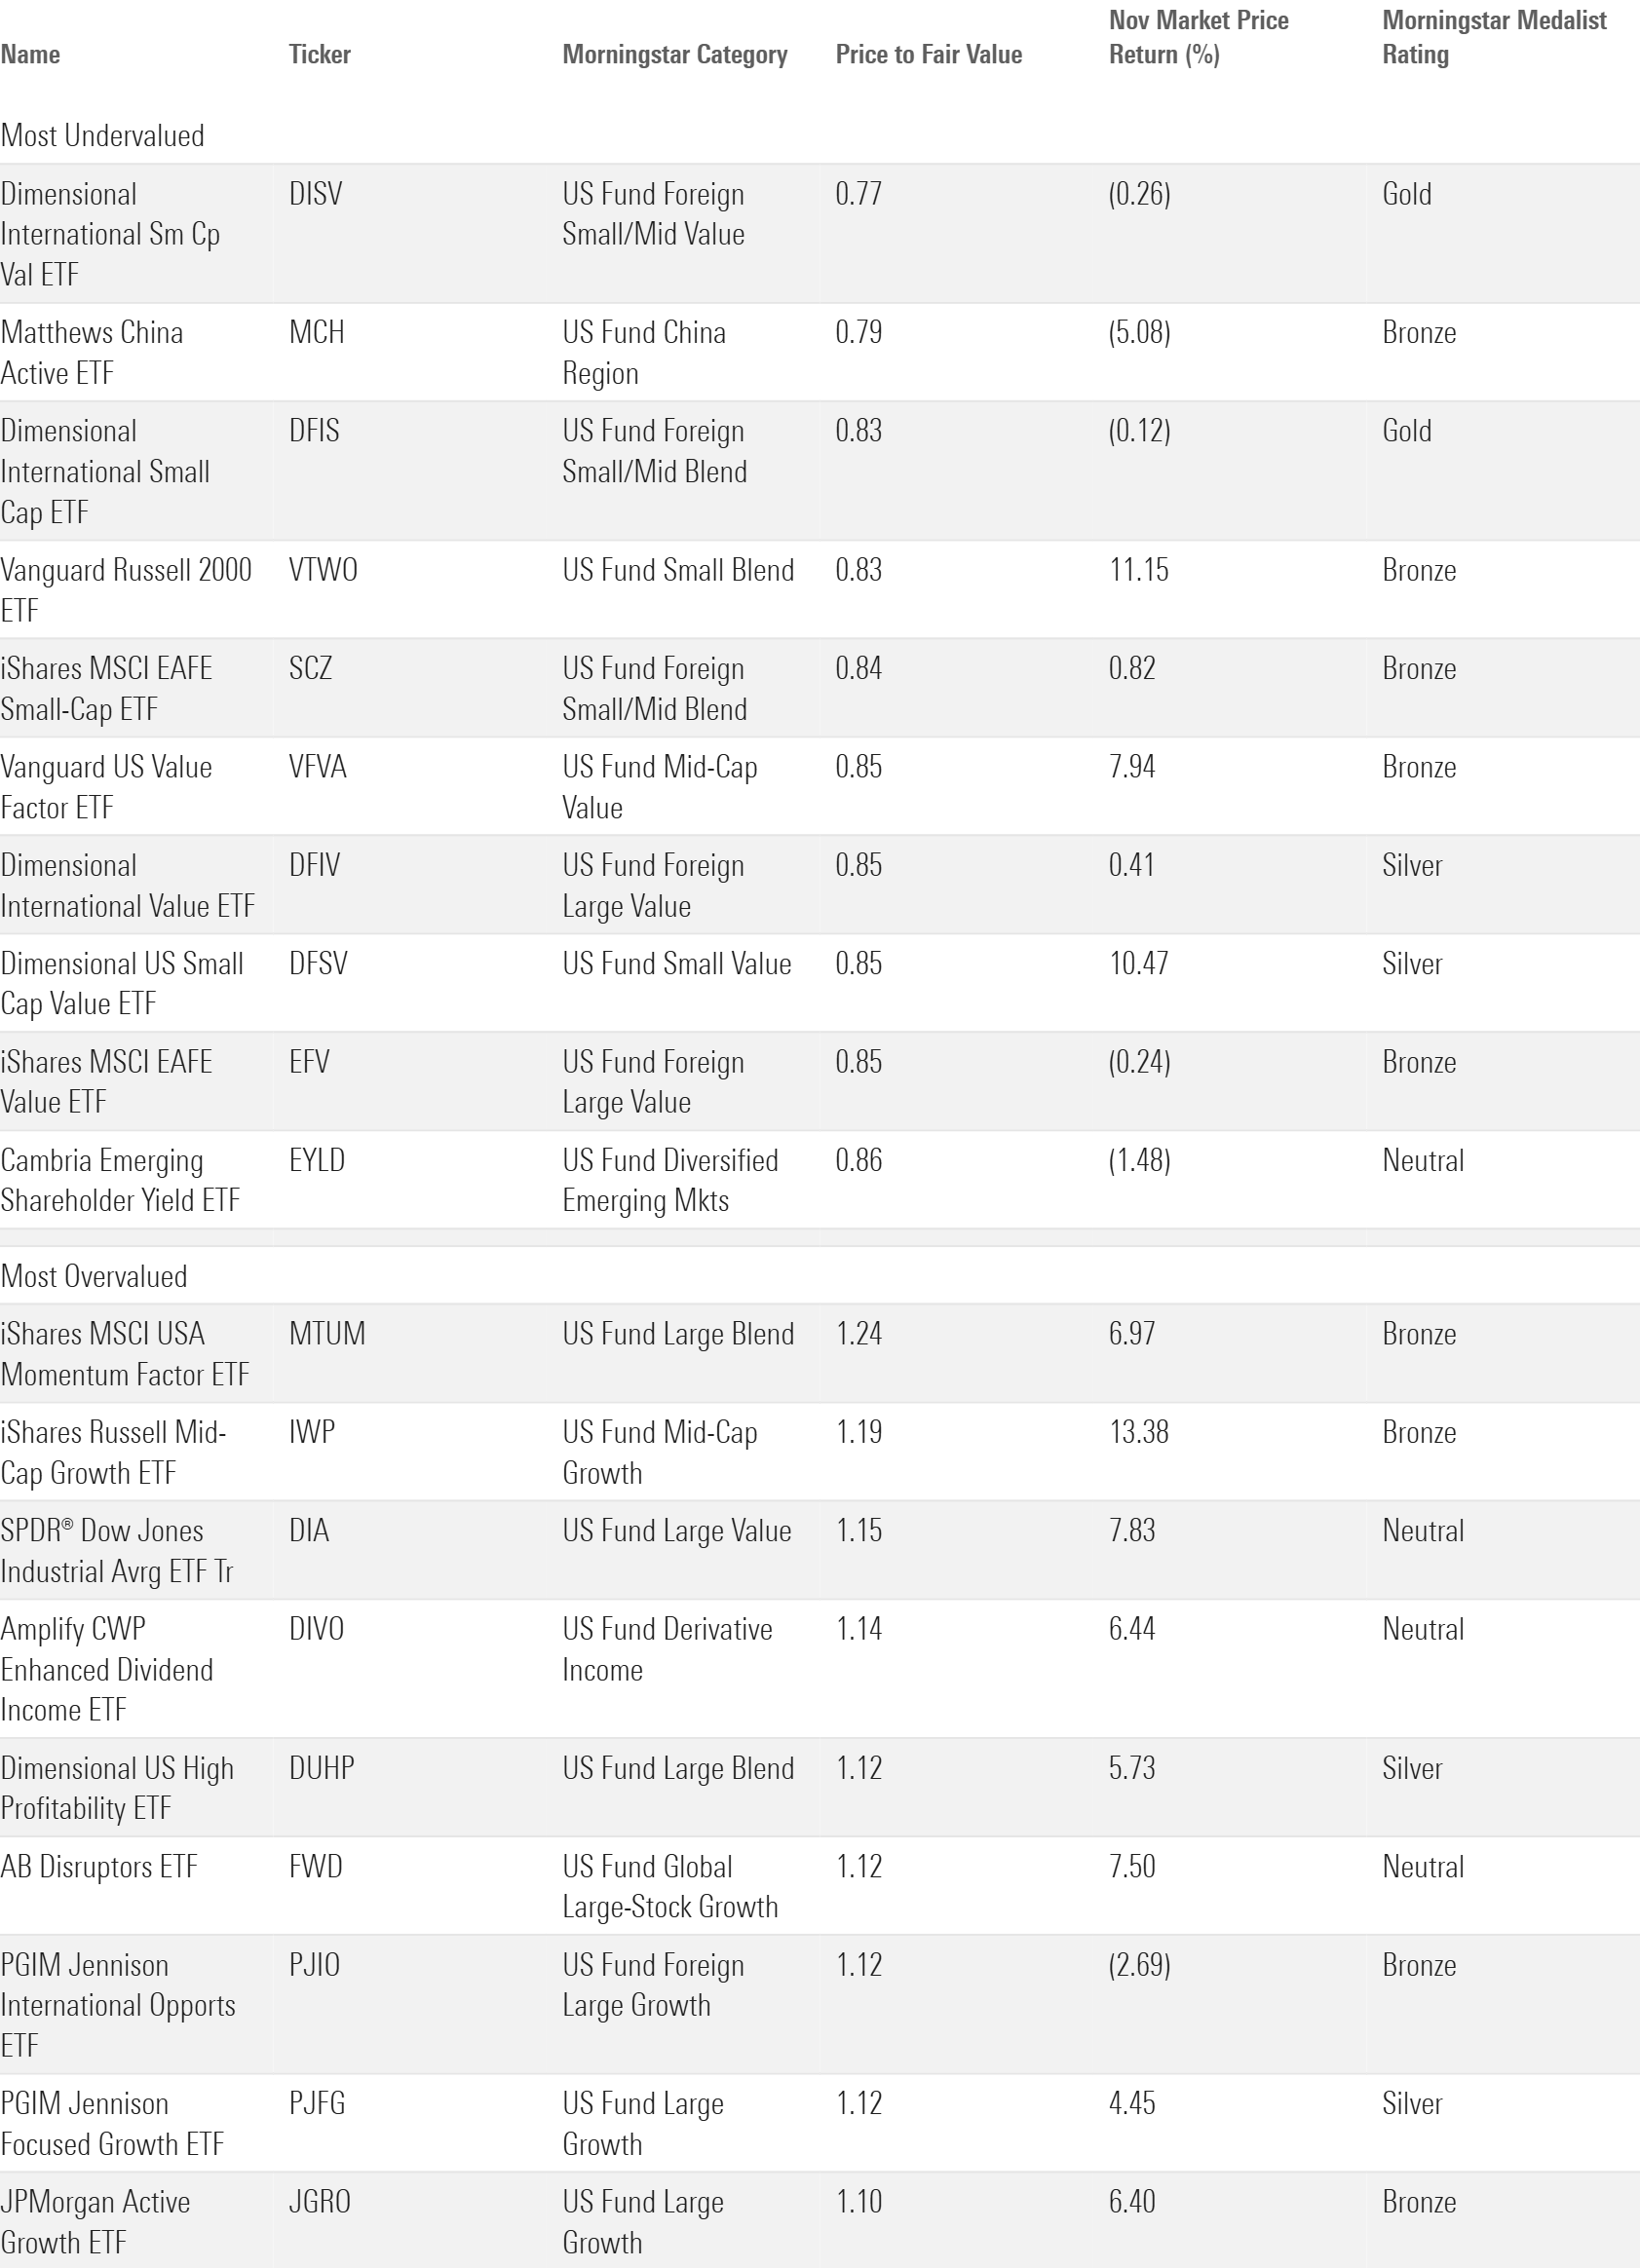
Morningstar recently published its year-end US stock market outlook, drawing on the same fundamental research that underpins the price/fair value estimate. The article circles the small-value category as the most undervalued corner of the market. Some funds on the cheaper half of Exhibit 6 fit that description, whether they invest overseas or stateside.
The author or authors do not own shares in any securities mentioned in this article. Find out about Morningstar’s editorial policies.

 United States