
US Fund Flows in 6 Charts: Bonds and Alternatives Stand Out in September
Equity funds post meager inflows.



US funds collected $55 billion in September, which is around their average monthly take rate in 2024. Enthusiasm for equity funds remained weak, with minor inflows into US and international equity funds and outflows from sector funds. Healthy inflows to the fixed-income and alternative category groups carried the month.
US Fund Flows
Record Quarter for ETFs Bolsters Taxable-Bond Flows
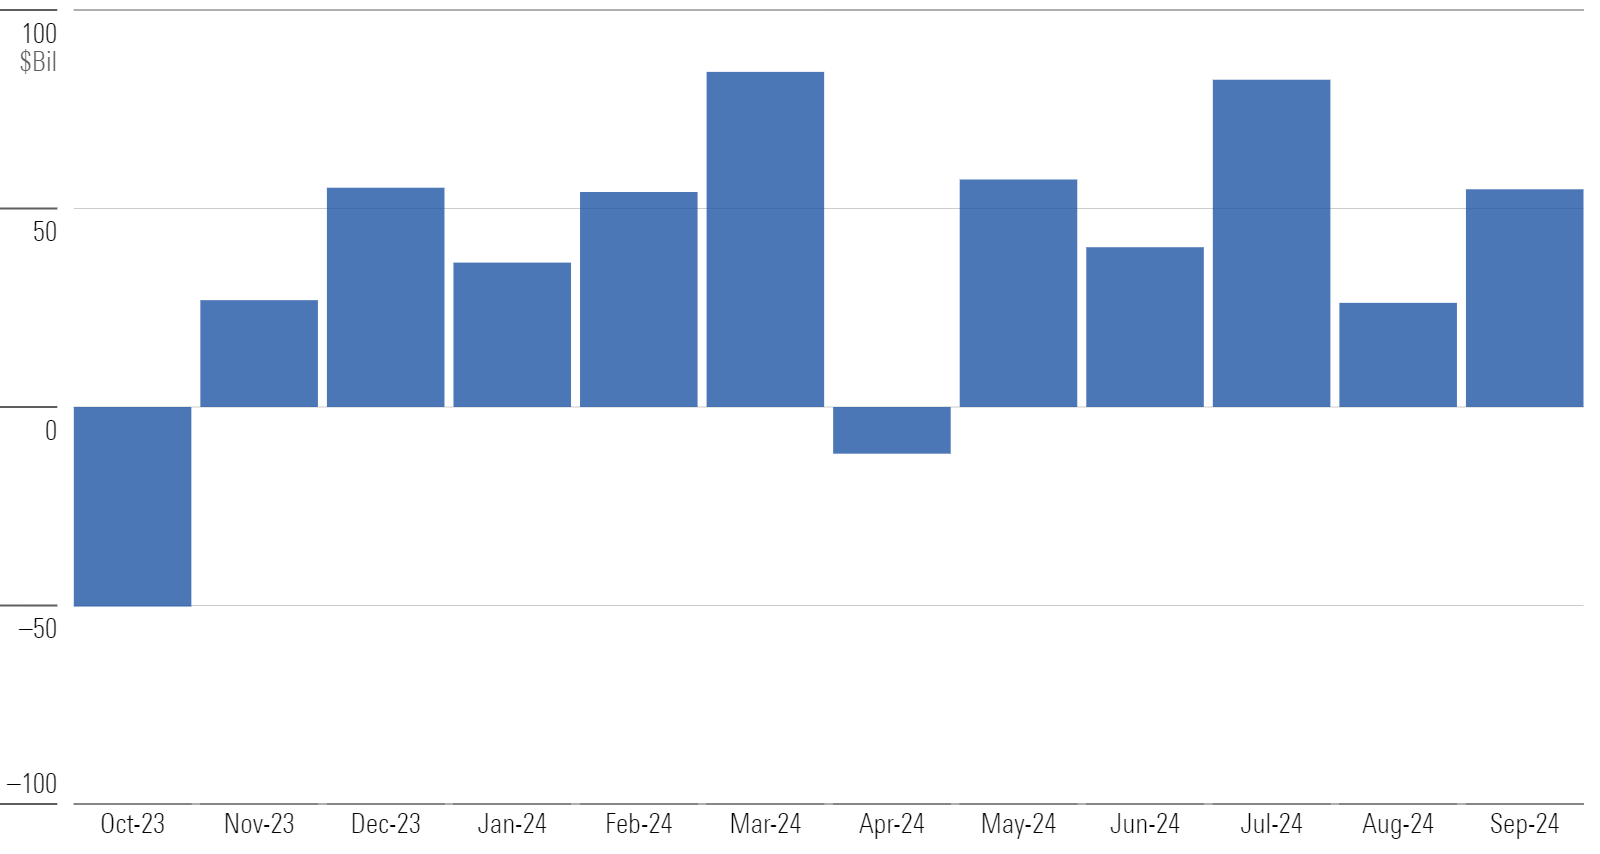
Taxable-bond exchange-traded funds reeled in a record $93 billion in the third quarter, helping the overall cohort to $124 billion of inflows. Bond ETFs have been popular for some time, but the rise of active ETFs and stronger mutual fund flows have driven an excellent year for the broader taxable-bond cohort. It raked in $351 billion over the first three quarters of 2024, which translates to a 6.8% organic growth rate.
Taxable-Bond Flows
S&P 500 Index Fund Dominance Continues
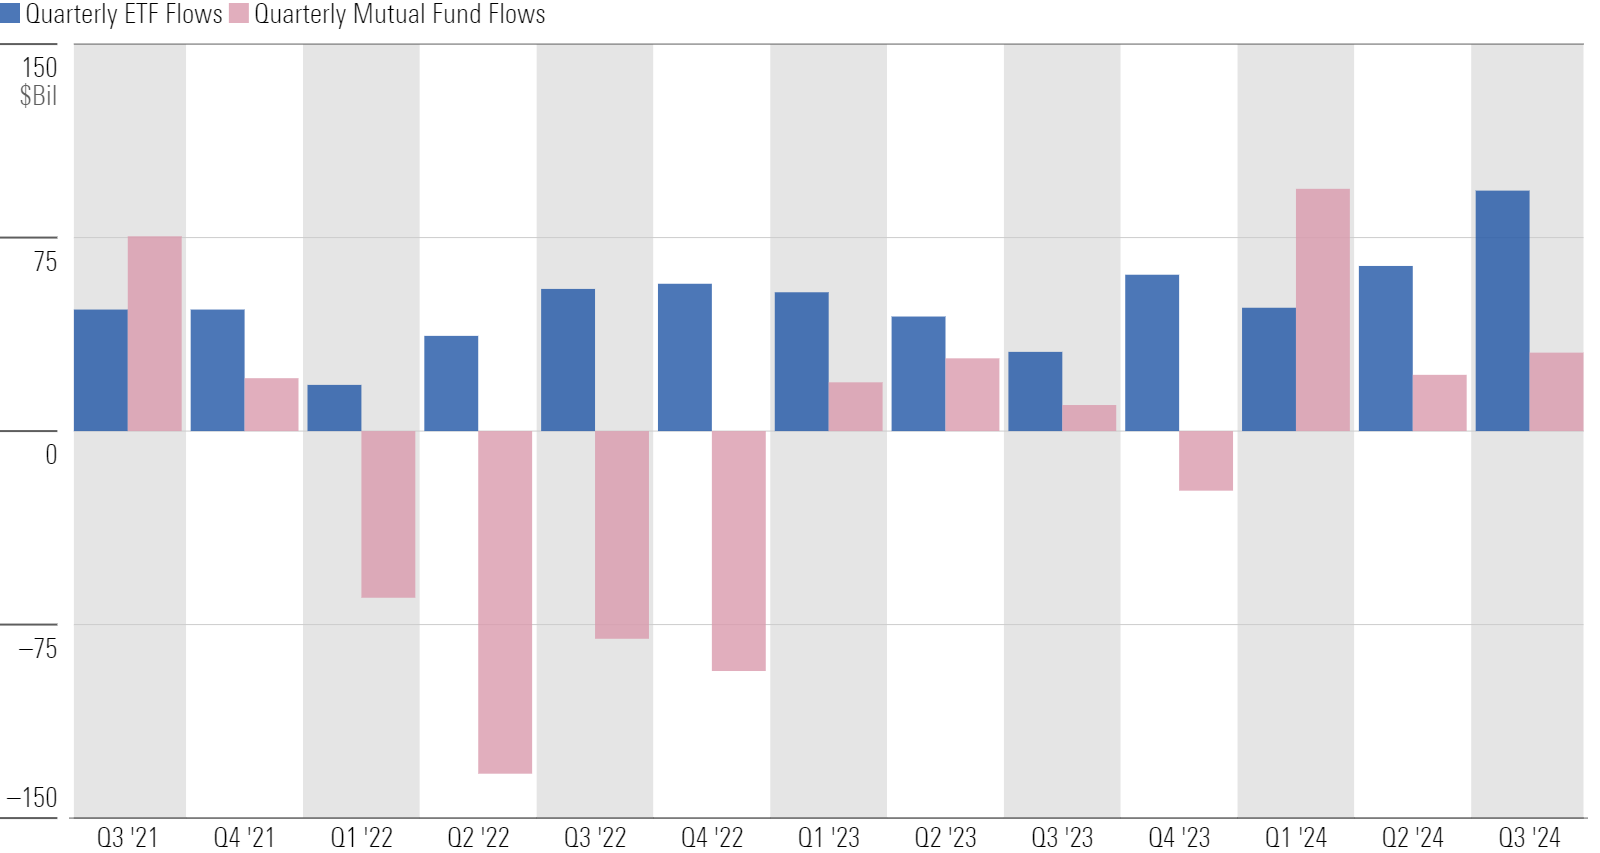
Funds tracking the S&P 500, which are mainly in the large-blend Morningstar Category, have taken in $128 billion so far in 2024 and are essentially the only reason for net inflows into US equity funds this year. Active funds remain in steady outflows. Mid-growth funds have shed a staggering $26 billion in 2024—nearly 7% of their total assets at the beginning of the year—with large-value and large-growth funds not far behind on an absolute basis.
Year-to-Date US Equity Flows for the Morningstar Style Box Categories
Chinese Stock Rally Draws Inflows
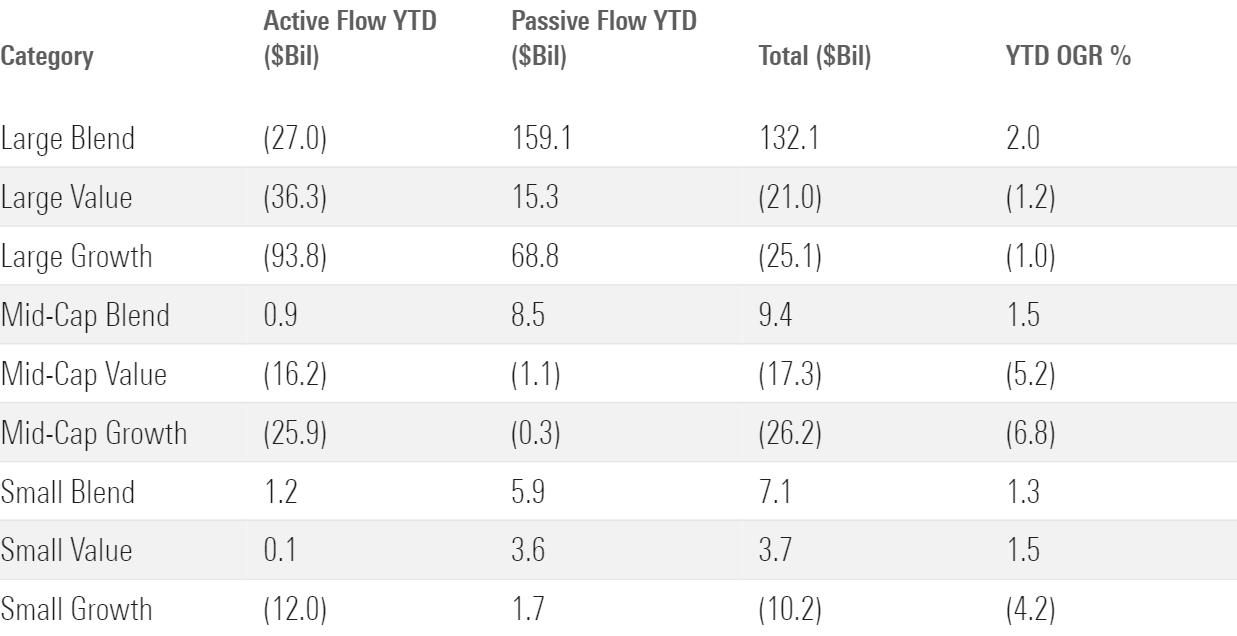
International-equity funds remain unpopular, having taken in a paltry $11 billion in 2024 relative to a $4.4 trillion asset base. Their roughly $6 billion collection in September was nothing to cheer about, but enthusiasm for China region funds resulted in a $2.6 billion haul for the category—the most since mid-2022. Chinese stocks ripped higher in September on news of potential government stimulus, likely luring in fresh flows.
China Region Fund Flows
Investors Stick to Their Alternatives: Buffer Funds and Crypto
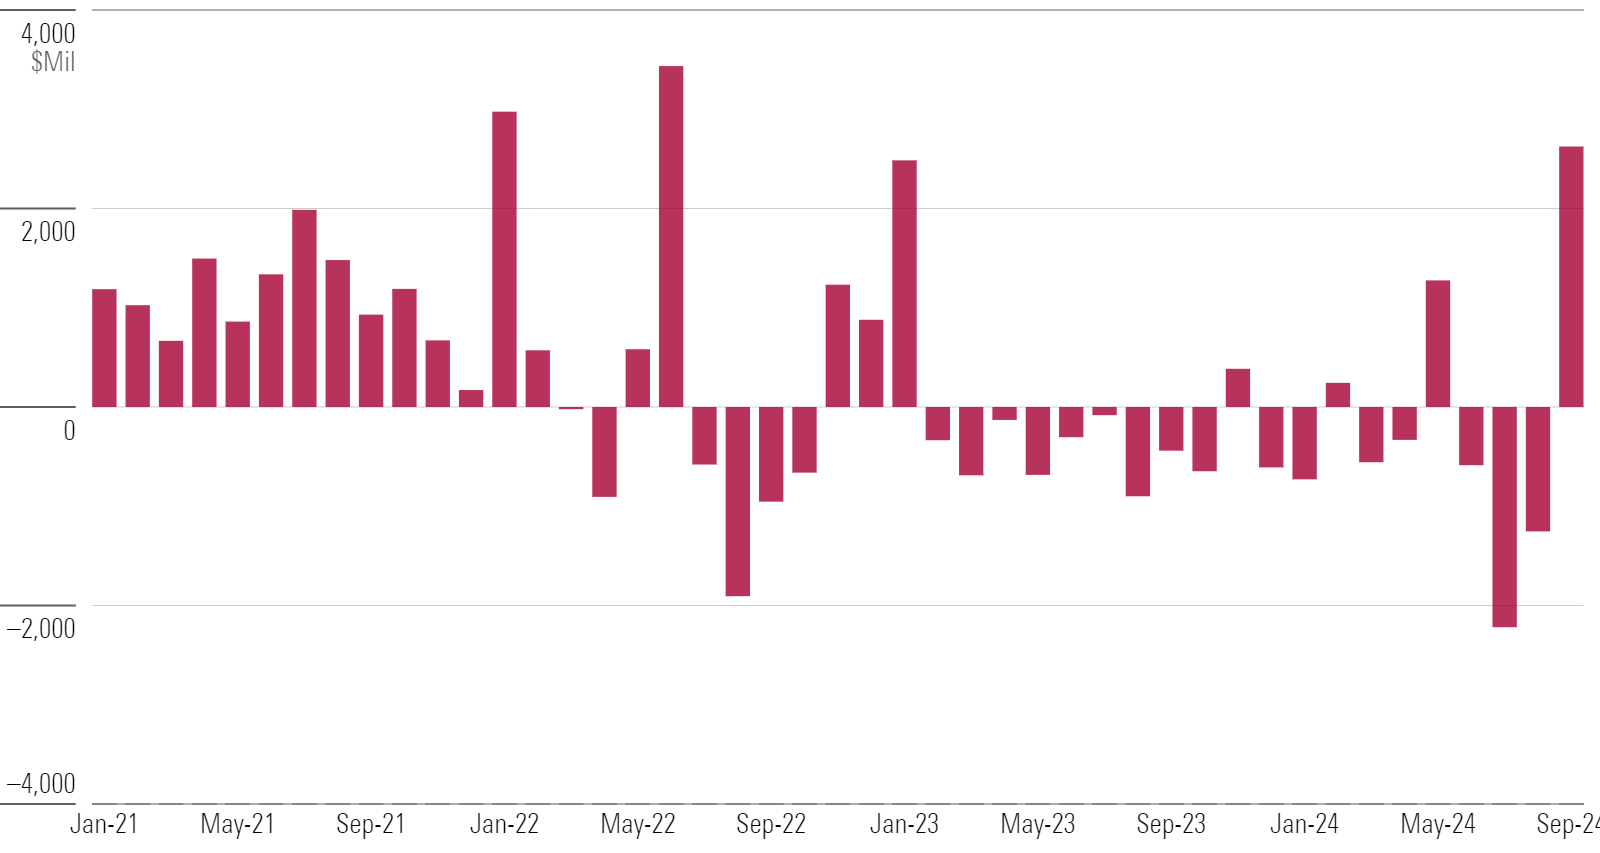
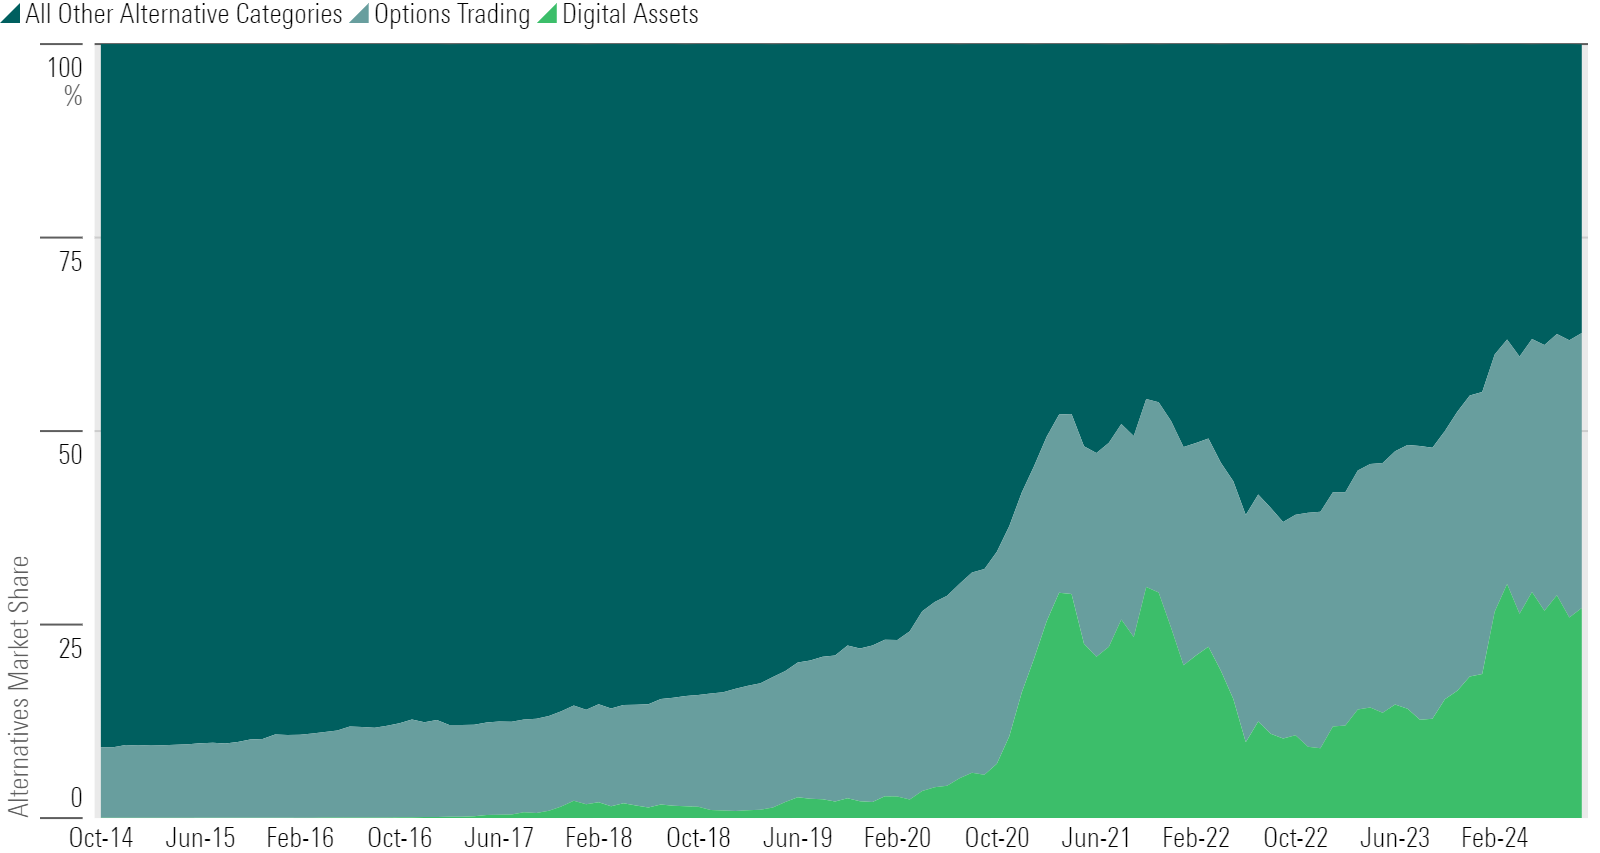
Alternatives hauled in $11 billion last quarter behind about $5 billion of flows into the digital-assets and options-trading categories. That was a solid quarter for digital assets, but inflows of $1 billion into new spot ethereum ETFs were far less than what spot bitcoin ETFs got in the first quarter. Back then, the category expanded its share of the alternatives market from 18% to 30%. Its market share held steady at 27% this time around.
Alternatives Flows
Not the Best, Western
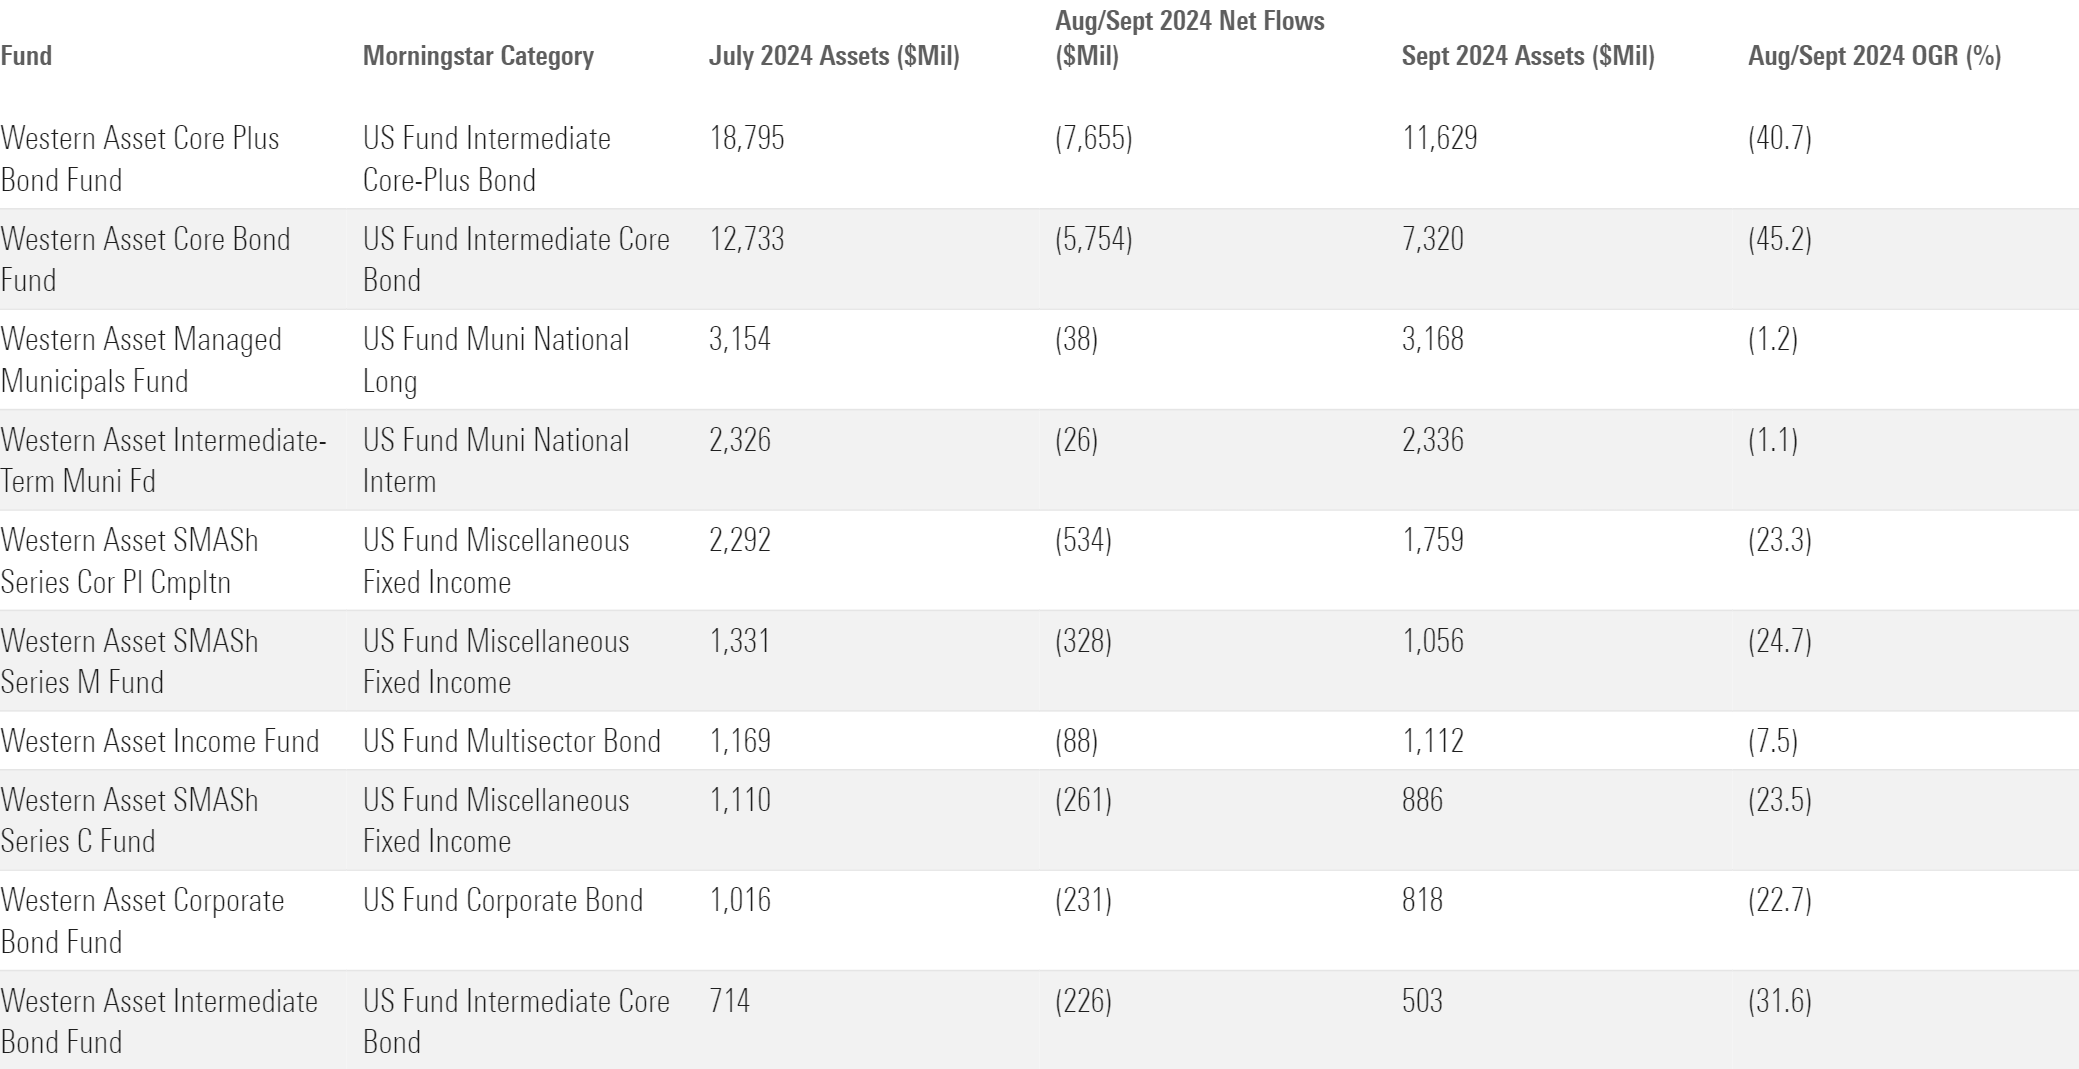
When Western Asset announced the departure of co-CIO Ken Leech amid an SEC investigation in late August, its fund investors ran for the hills. The firm, which sits within the Franklin Templeton fund family, endured nearly $16 billion of outflows in August and September 2024. It finished the third quarter with about $35 billion in assets, down from $50 billion at the end of July.
Western Asset Flows
This article is adapted from the Morningstar Direct US Asset Flows Commentary for September 2024. Download the full report here.
The author or authors do not own shares in any securities mentioned in this article. Find out about Morningstar’s editorial policies.

 United States