
US Fund Flows: Flows Get a Trump Bump
Surging ETF flows power strong November.



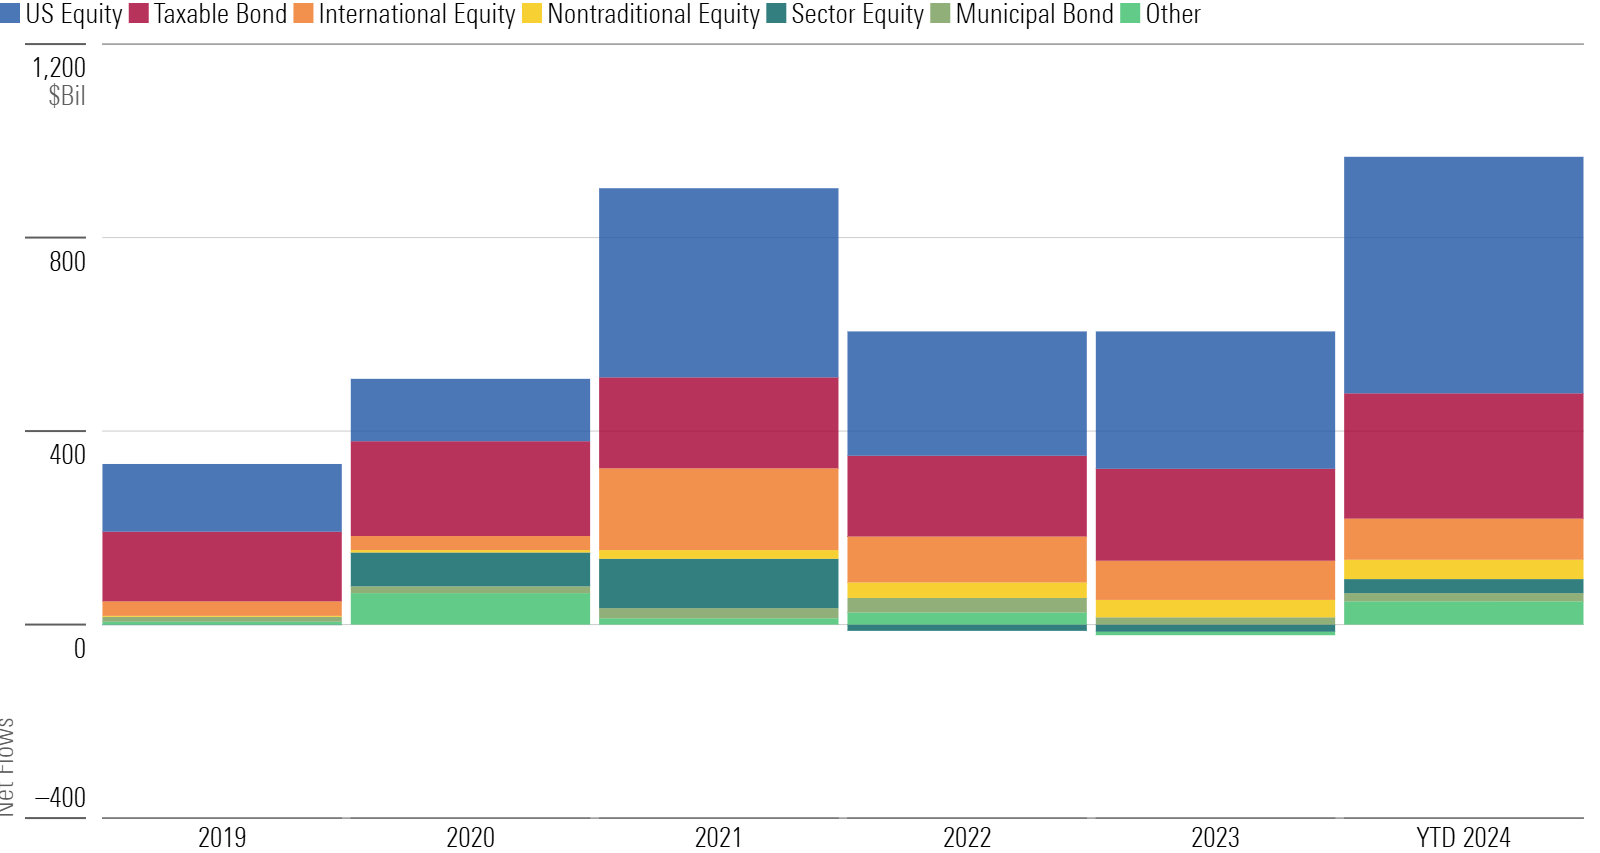
US funds raked in $115 billion in November, their highest total since April 2021. Relative to earlier in the year, US equity and sector-equity funds came back to life after a sleepy stretch, both enjoying their best months of 2024. The market’s cheery reaction to Trump’s election sent stock prices higher and likely energized the broader equity-fund investor base.
US Fund Flows
Milestone Month for ETFs
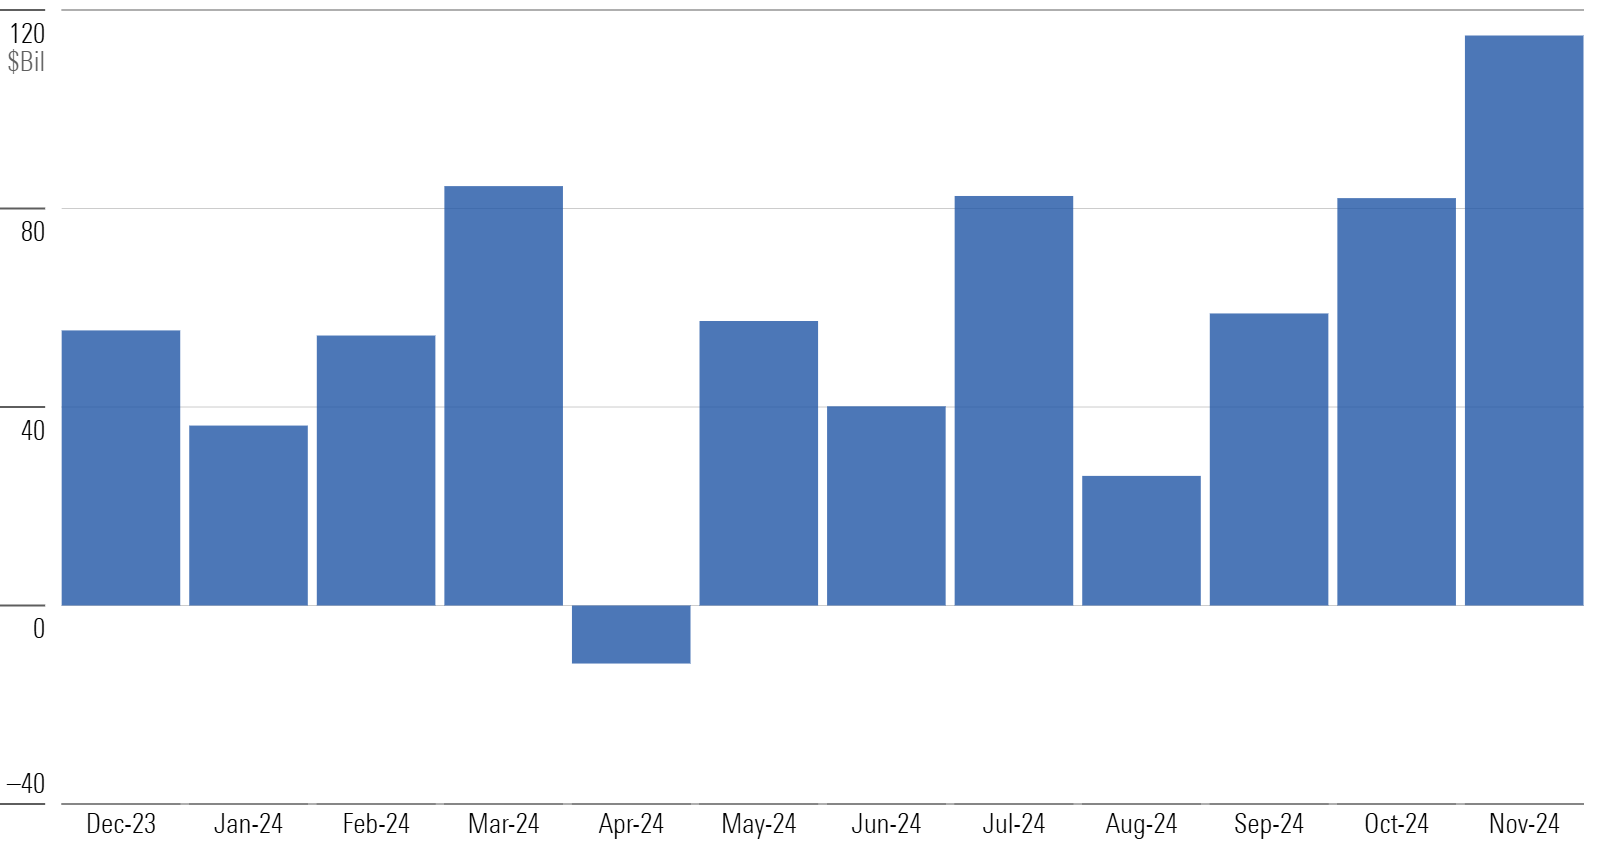
Exchange-traded funds raked in a record $159 billion in November to reach $966 billion of inflows in the year. That broke the previous annual record of $901 billion in 2021. ETFs’ organic growth rate of 16.4% that year will be hard to beat, though; this year’s rate was 11.9% through November. But with one month left on the calendar, ETFs will almost certainly book their first $ 1 trillion year of flows.
ETF Flows
US Equity Index Funds Reap Rewards in November
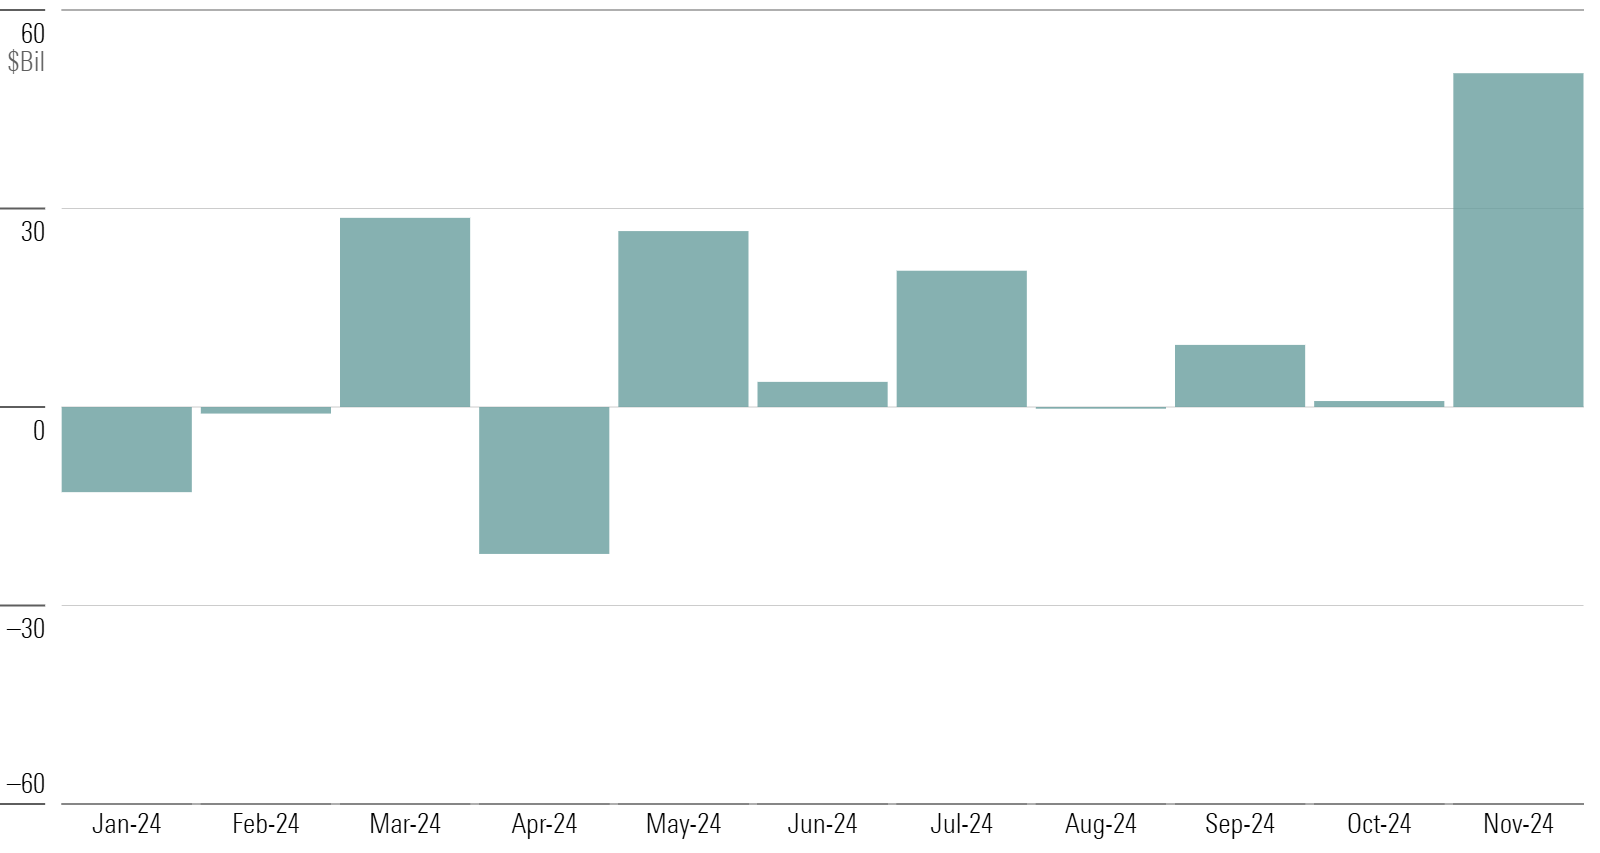
US equity funds enjoyed their strongest monthly inflow since March 2021, collecting just over $50 billion. That figure represented their best organic growth rate since December 2023 and one of the best results over the past five years. Six of the nine Morningstar Style Box categories enjoyed inflows in November. Index funds took in $78 billion, while active funds shed nearly $28 billion.
US Equity Flows
Sector-Equity Fund Flows Pop
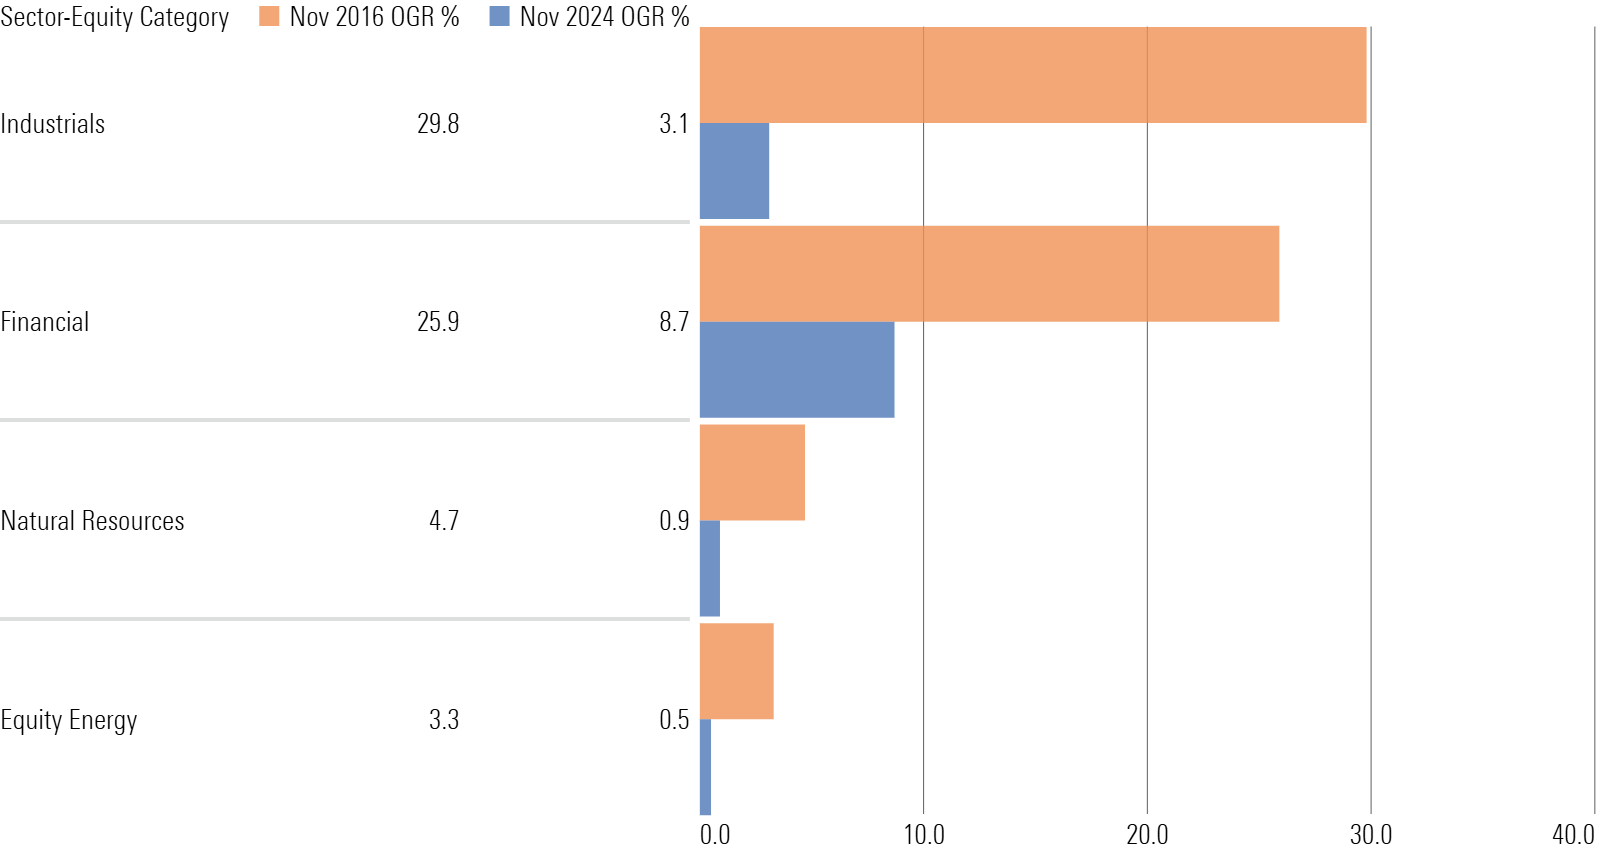
After being mired in a multiyear slump, sector-equity funds awakened in November, taking in $12 billion—their most since March 2021. The category group had enjoyed just eight months of inflows since the start of 2022. Investors borrowed some lessons from Trump’s previous election win in 2016, pouring money into cyclical sectors such as financial and industrials, though at lower rates.
Sector-Equity Organic Growth Rates
Regulatory Optimism Shoots Crypto Prices and Related Fund Flows Higher
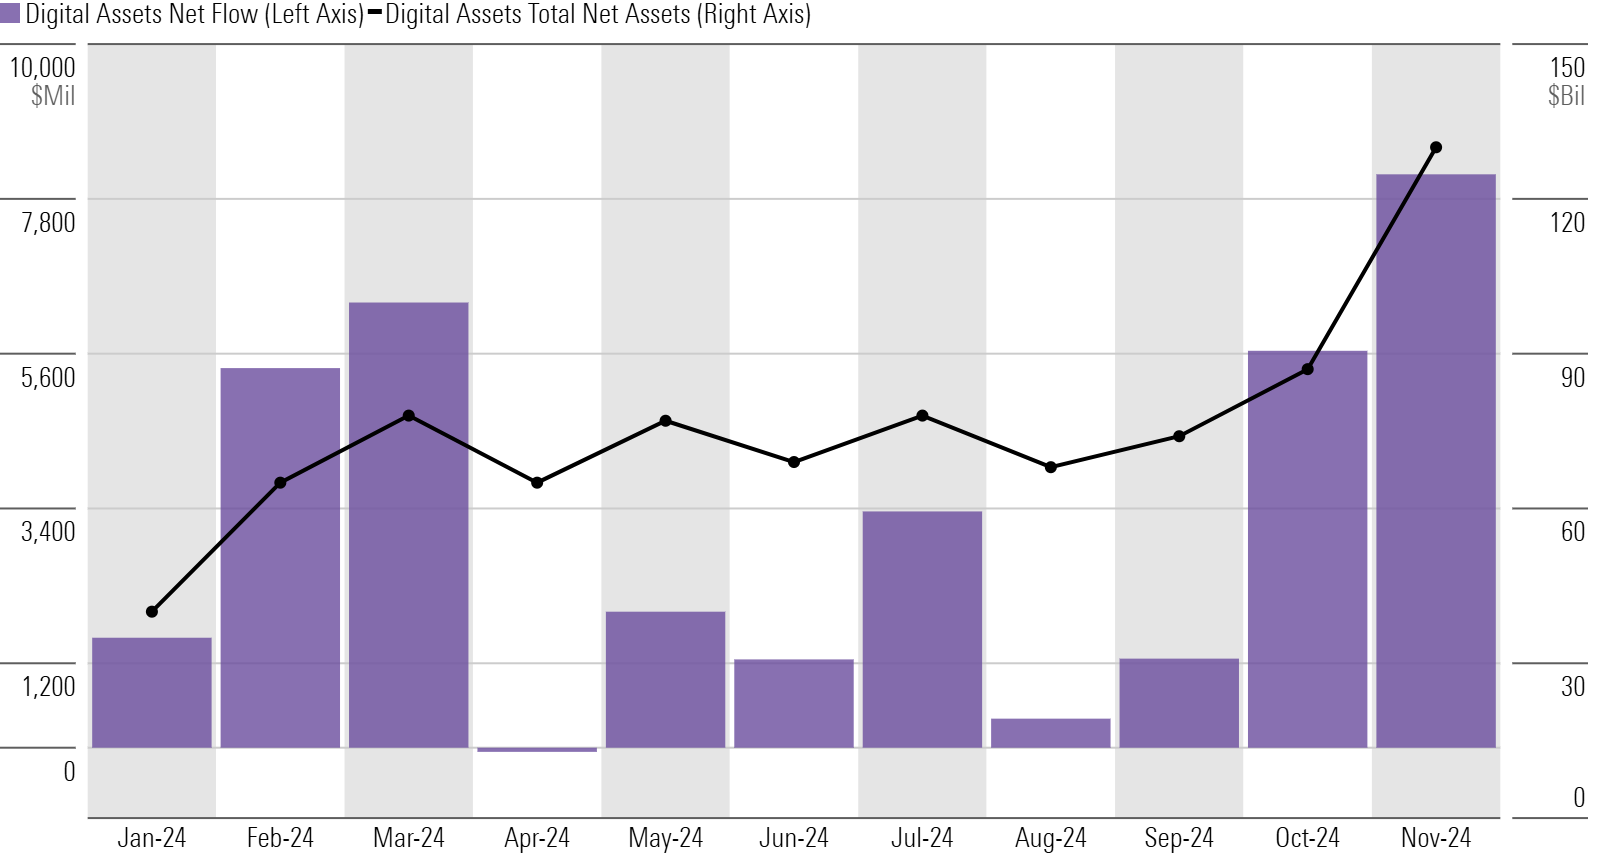
Market activity suggests investors bought the hype of a more cryptocurrency-friendly administration. The price of bitcoin rose from around $70,000 to nearly $100,000 over the course of November. Investor activity might have contributed to the surge. They poured $8.2 billion into digital assets funds in November, representing virtually all net flows into the alternative category group.
Digital Assets Flows
Flows Into Government-Bond Funds Flatten Out
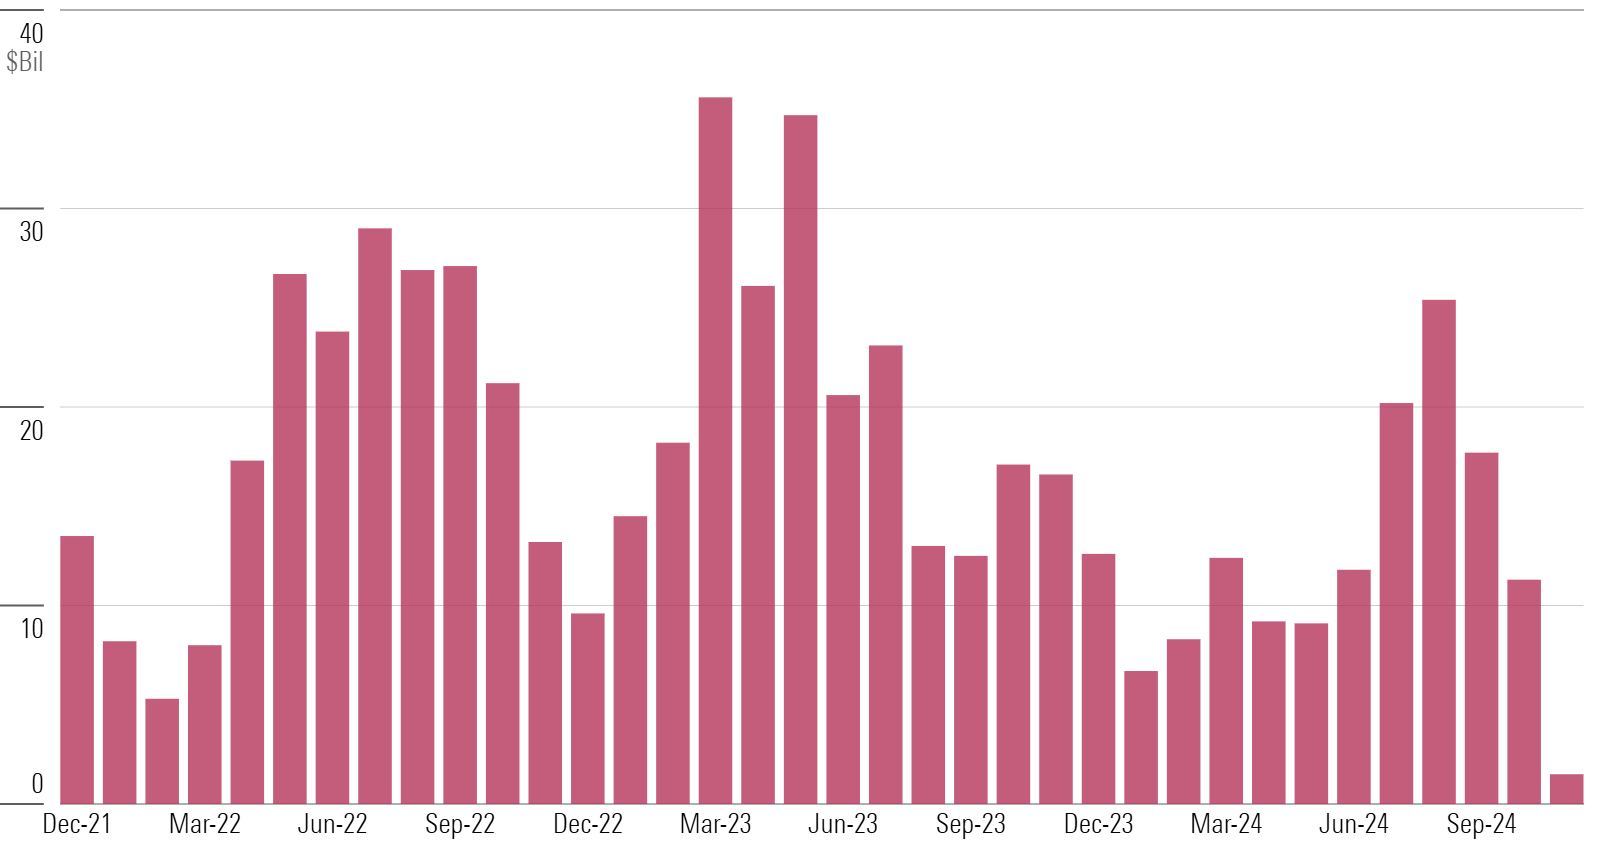
A popular choice for most of the past three years, Treasury funds have seen recent flows taper. They gathered $1.5 billion of net flows over the past three months, their worst three-month total since the period ended February 2017. With securities that are virtually free of default risk, these funds have slid to the back burner at the expense of riskier options.
Government Bond Flows
This article is adapted from the Morningstar Direct US Asset Flows Commentary for November 2024. Download the full report here.
The author or authors do not own shares in any securities mentioned in this article. Find out about Morningstar’s editorial policies.

 United States