
6 Charts on How Trump’s Tariffs Have Upended Global Markets
A historic surge in US tariffs rattles markets, weakens the US dollar, and reshapes economic expectations.


President Donald Trump’s on-again, off-again tariffs have sent markets on a roller-coaster ride so far in 2025. Morningstar’s Markets Observer report is here to help you make sense of the turmoil. Morningstar Direct clients can access the full report via Direct Compass.
Below is a summary of key findings, including an analysis of ripple effects from Morningstar’s Senior US Economist Preston Caldwell.
Tariffs Trigger a Major Market Shift
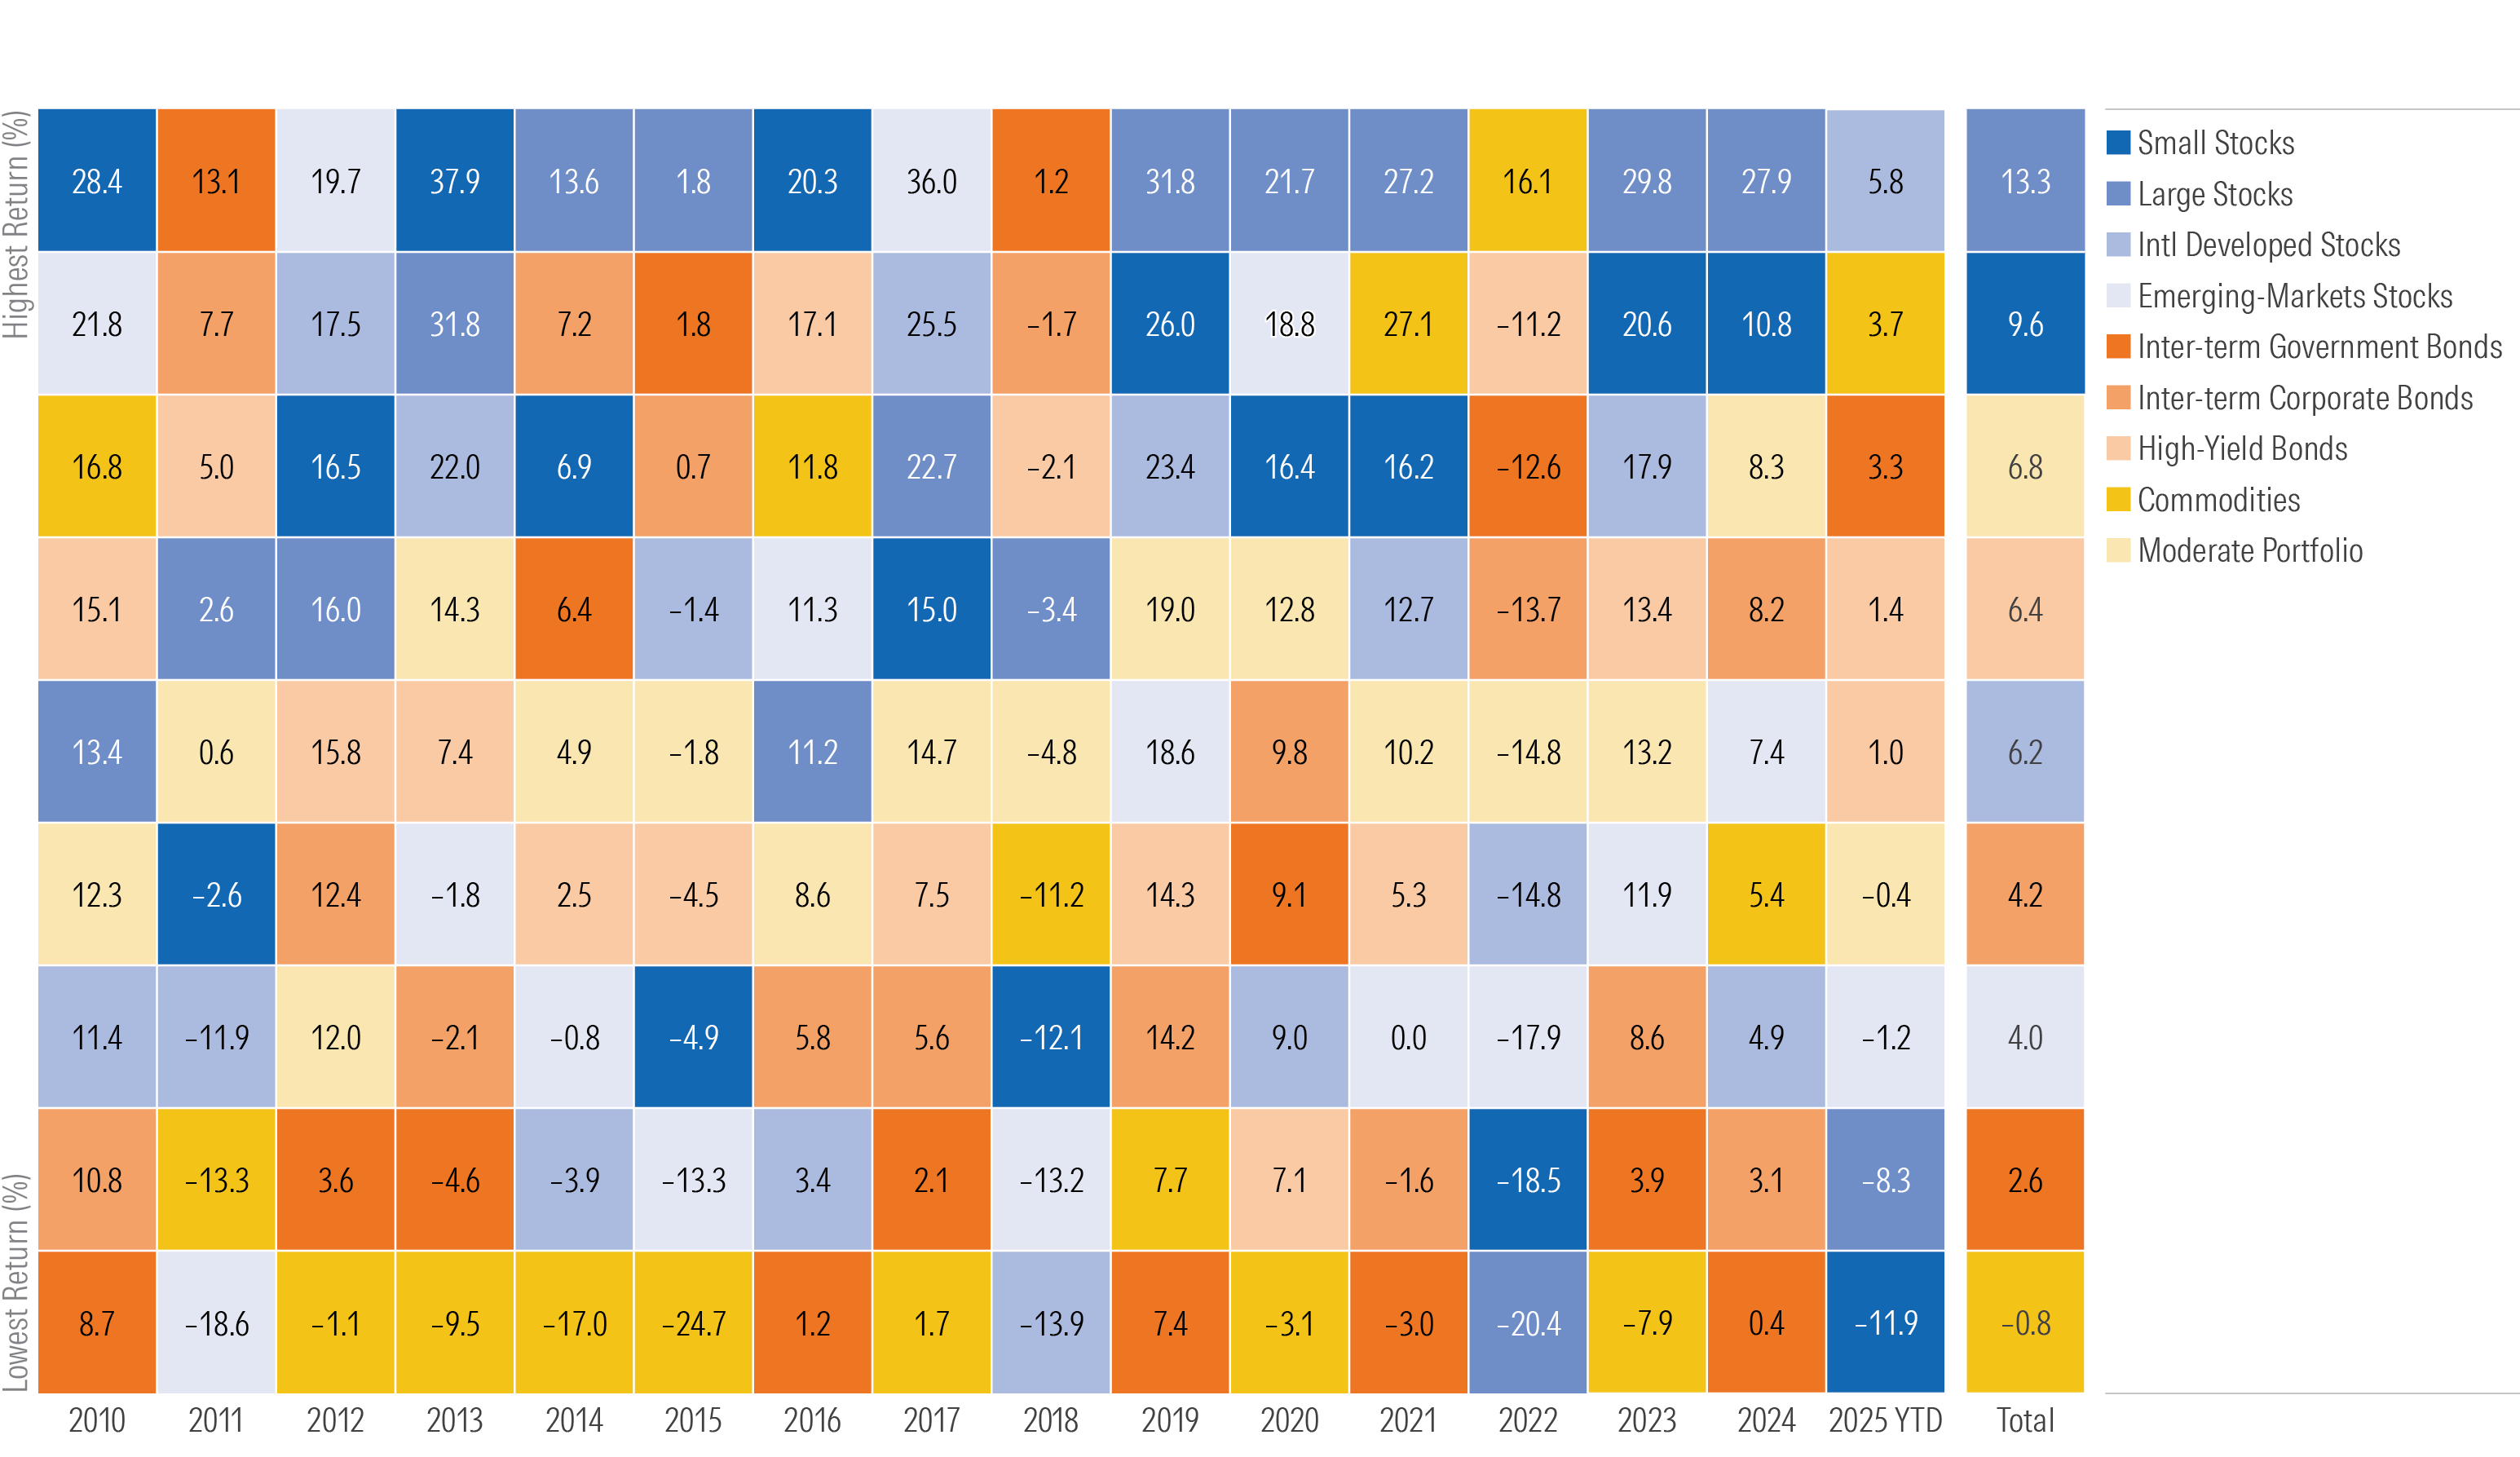
US equities—which have dominated global returns for years—hit a wall in early 2025. Through April 15, both US large-cap and US small-cap stocks were down sharply as tariff policy wreaked havoc. In contrast, international-developed markets posted modest gains, while commodities (in particular gold) surged. Few believed that tariffs would be the catalyst to finally tilt the scales away from US stocks, but that’s exactly what happened.
Asset Class Winners and Losers
Broad Market Disruption
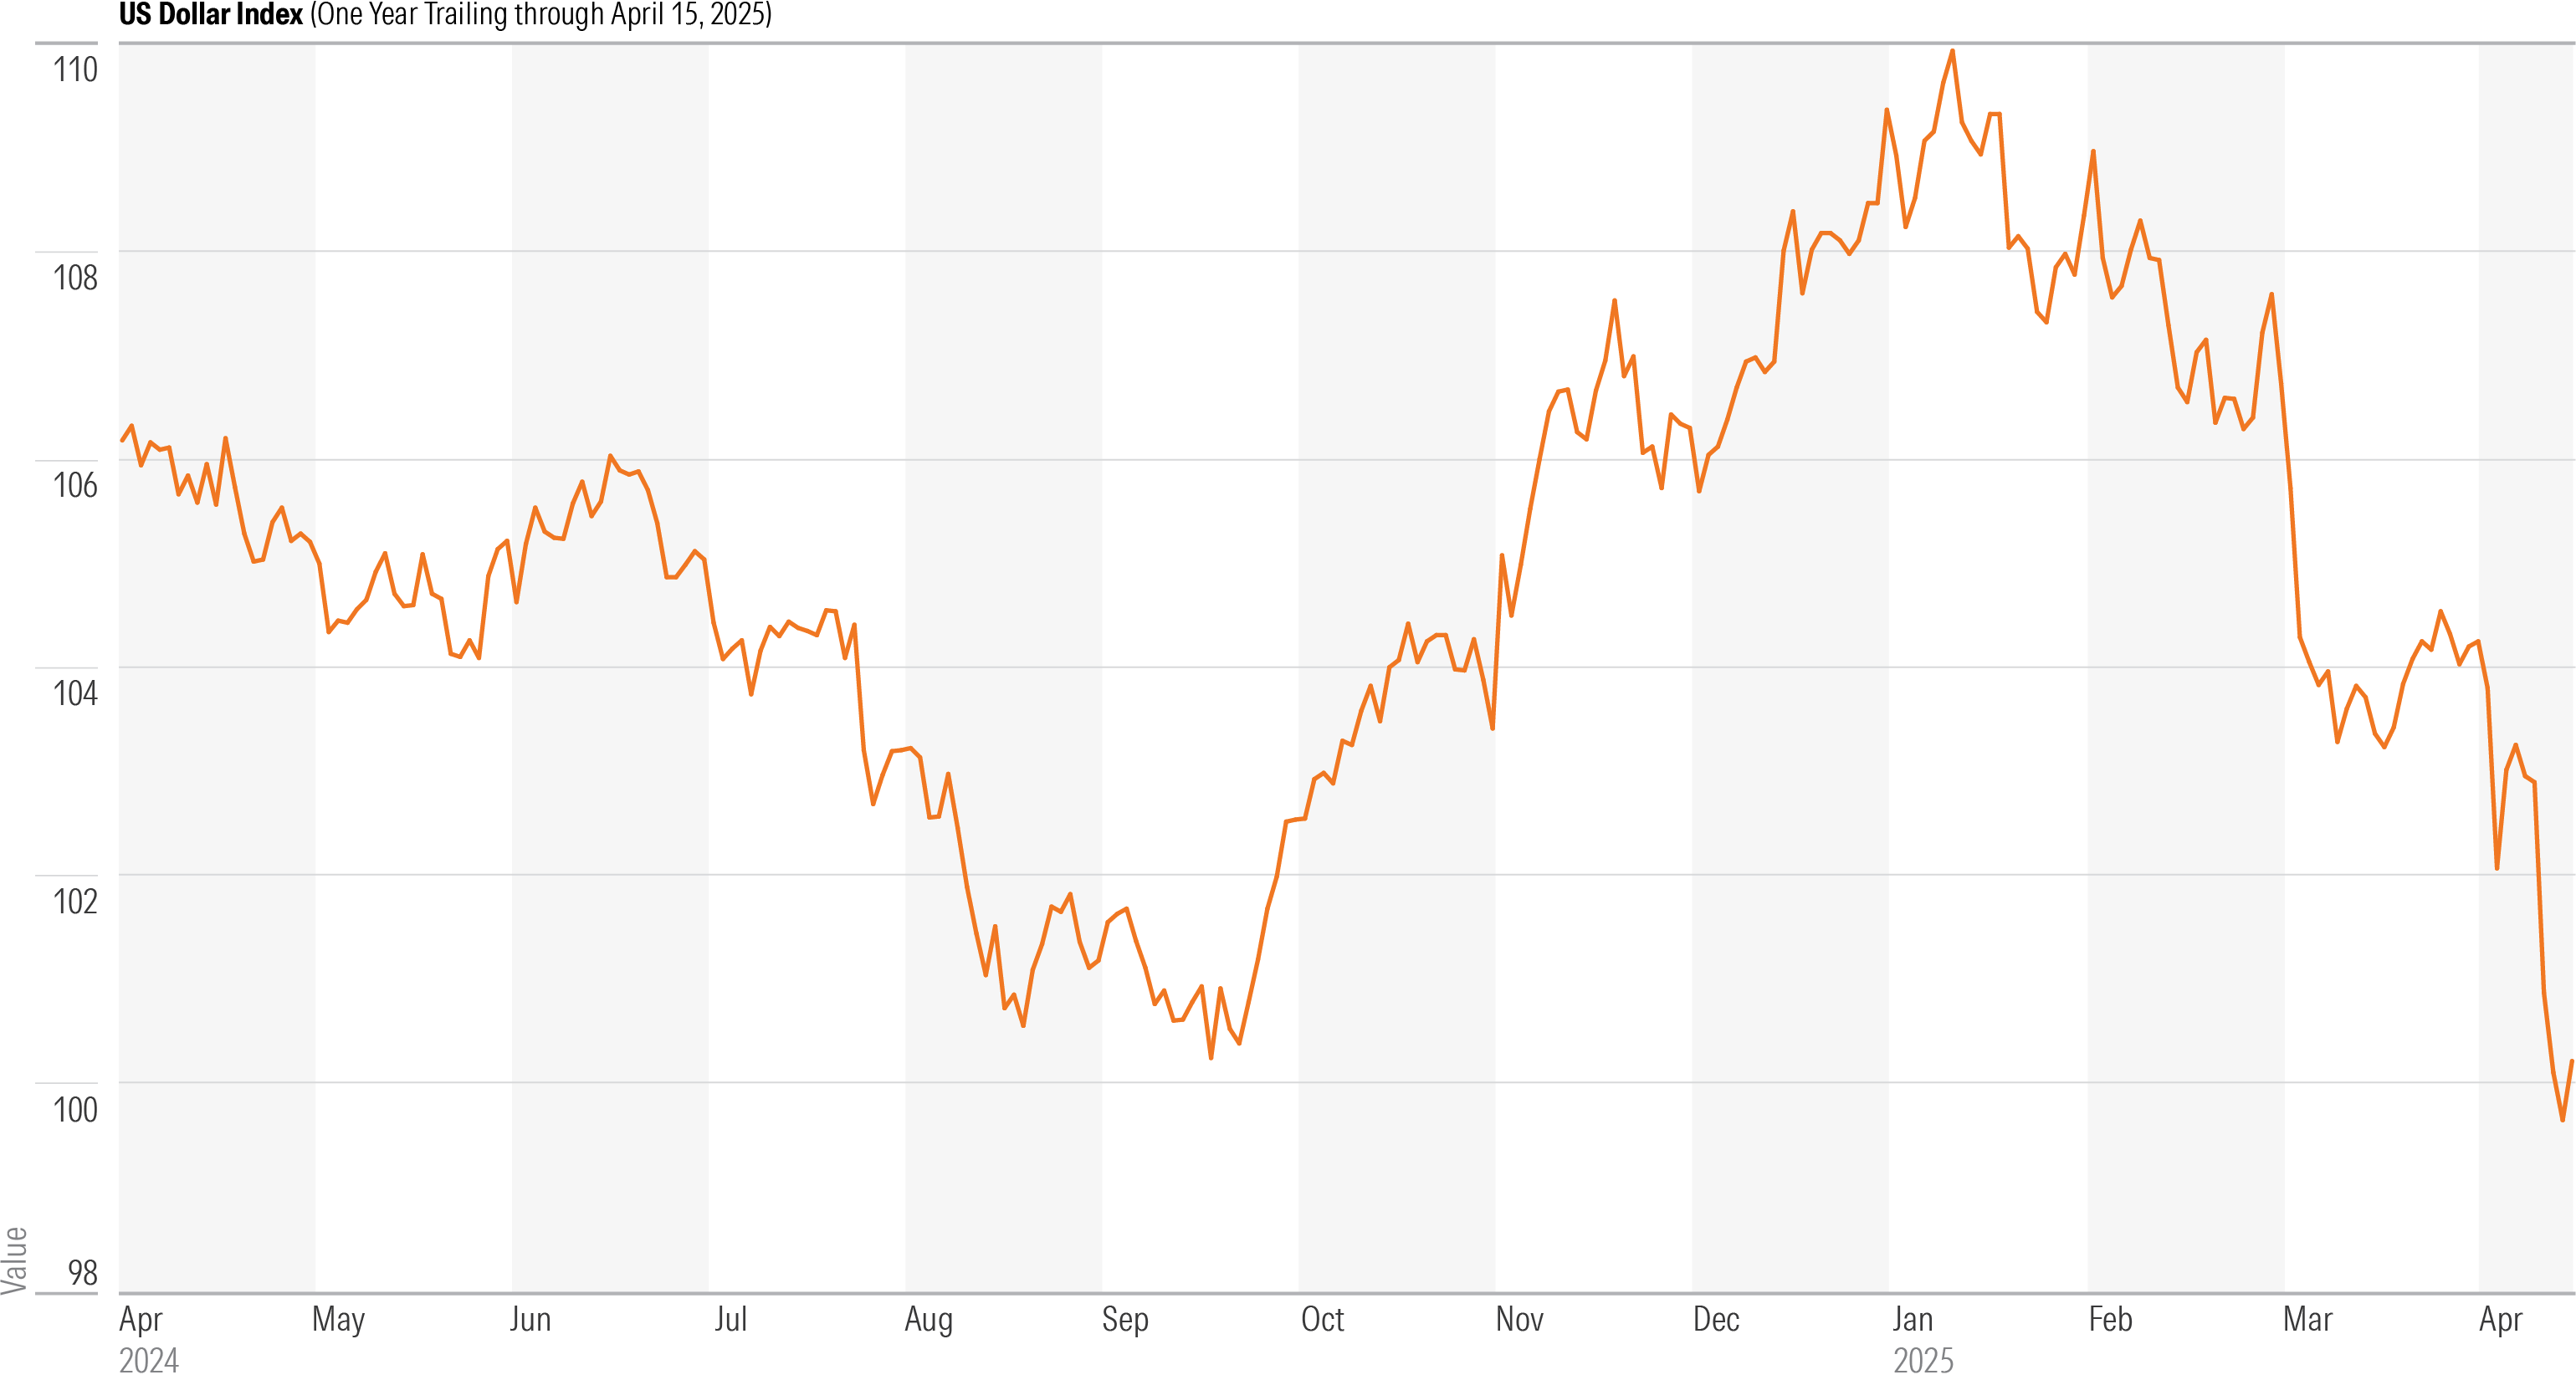
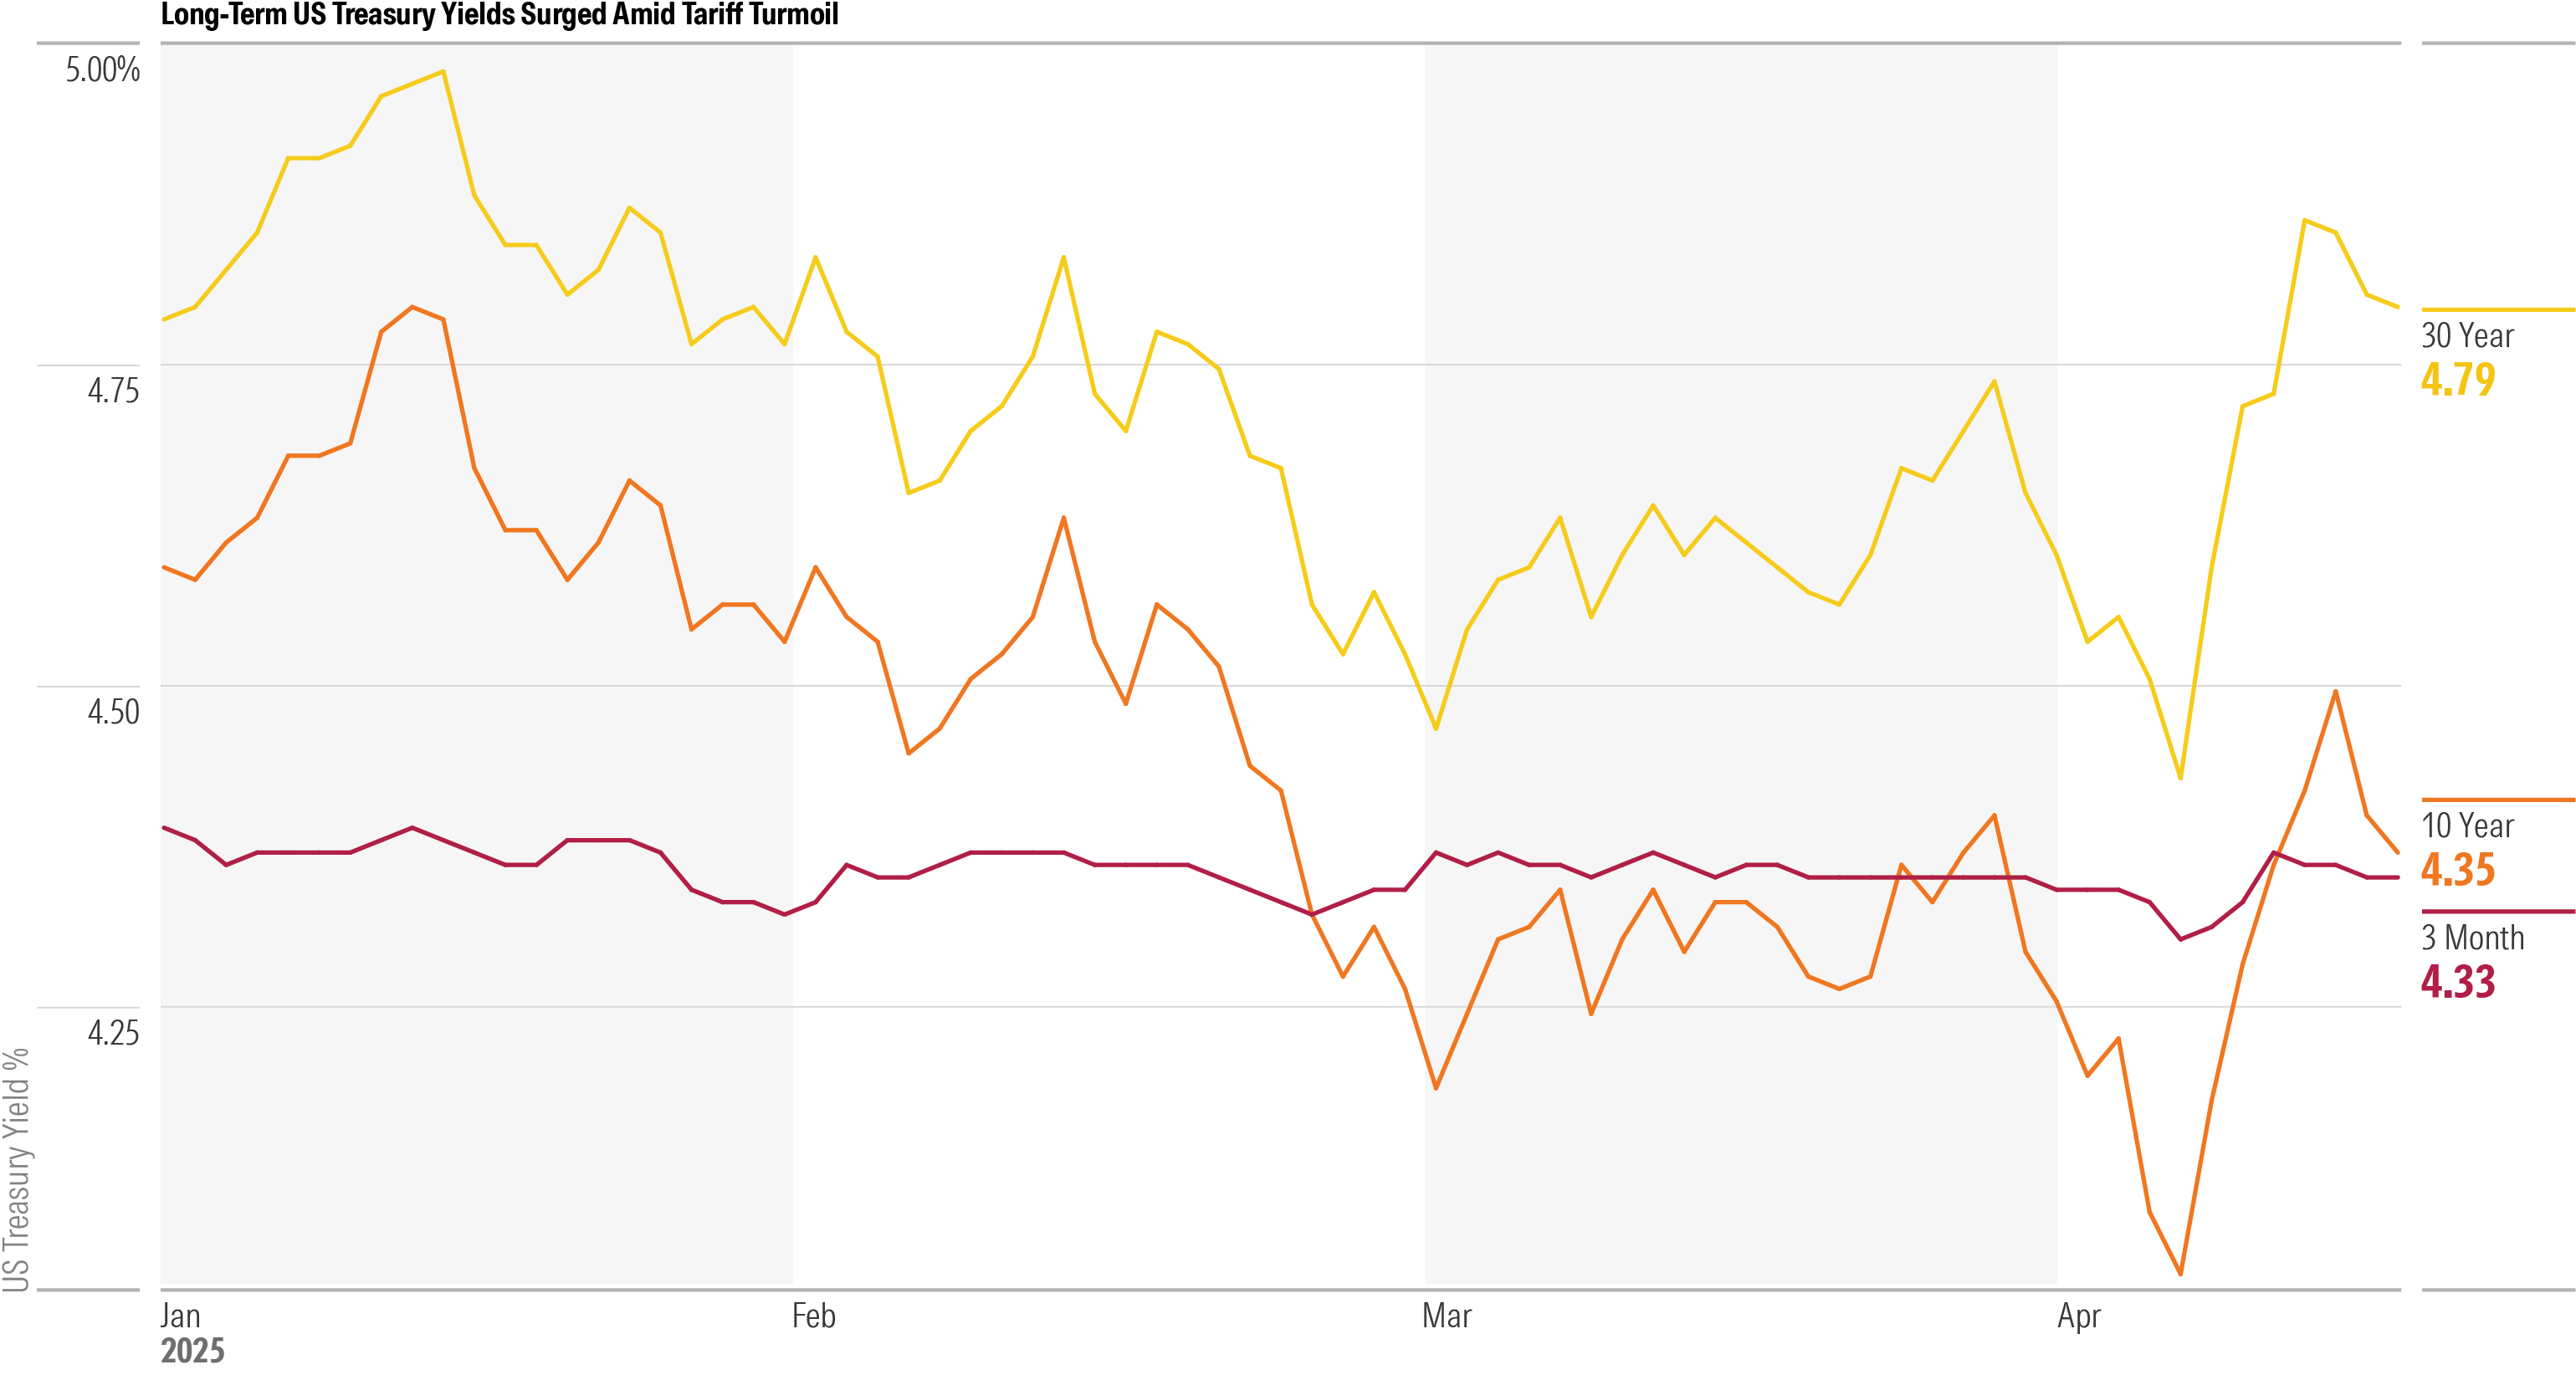
The tariff shock hasn’t been limited to equities. It also roiled currency and bond markets. The US dollar has weakened significantly since January 2025, while the 30-year US Treasury yield spiked 45 basis points in just four days beginning April 7—a move only seen three times since 1990. These shifts reflect mounting fears over inflation, swelling fiscal deficits, threats to central bank independence, and forced selling by leveraged investors.
The US Dollar Has Weakened in Early 2025
Investors Demand Premium for Long-Term US Treasuries
End of the Free Trade Era
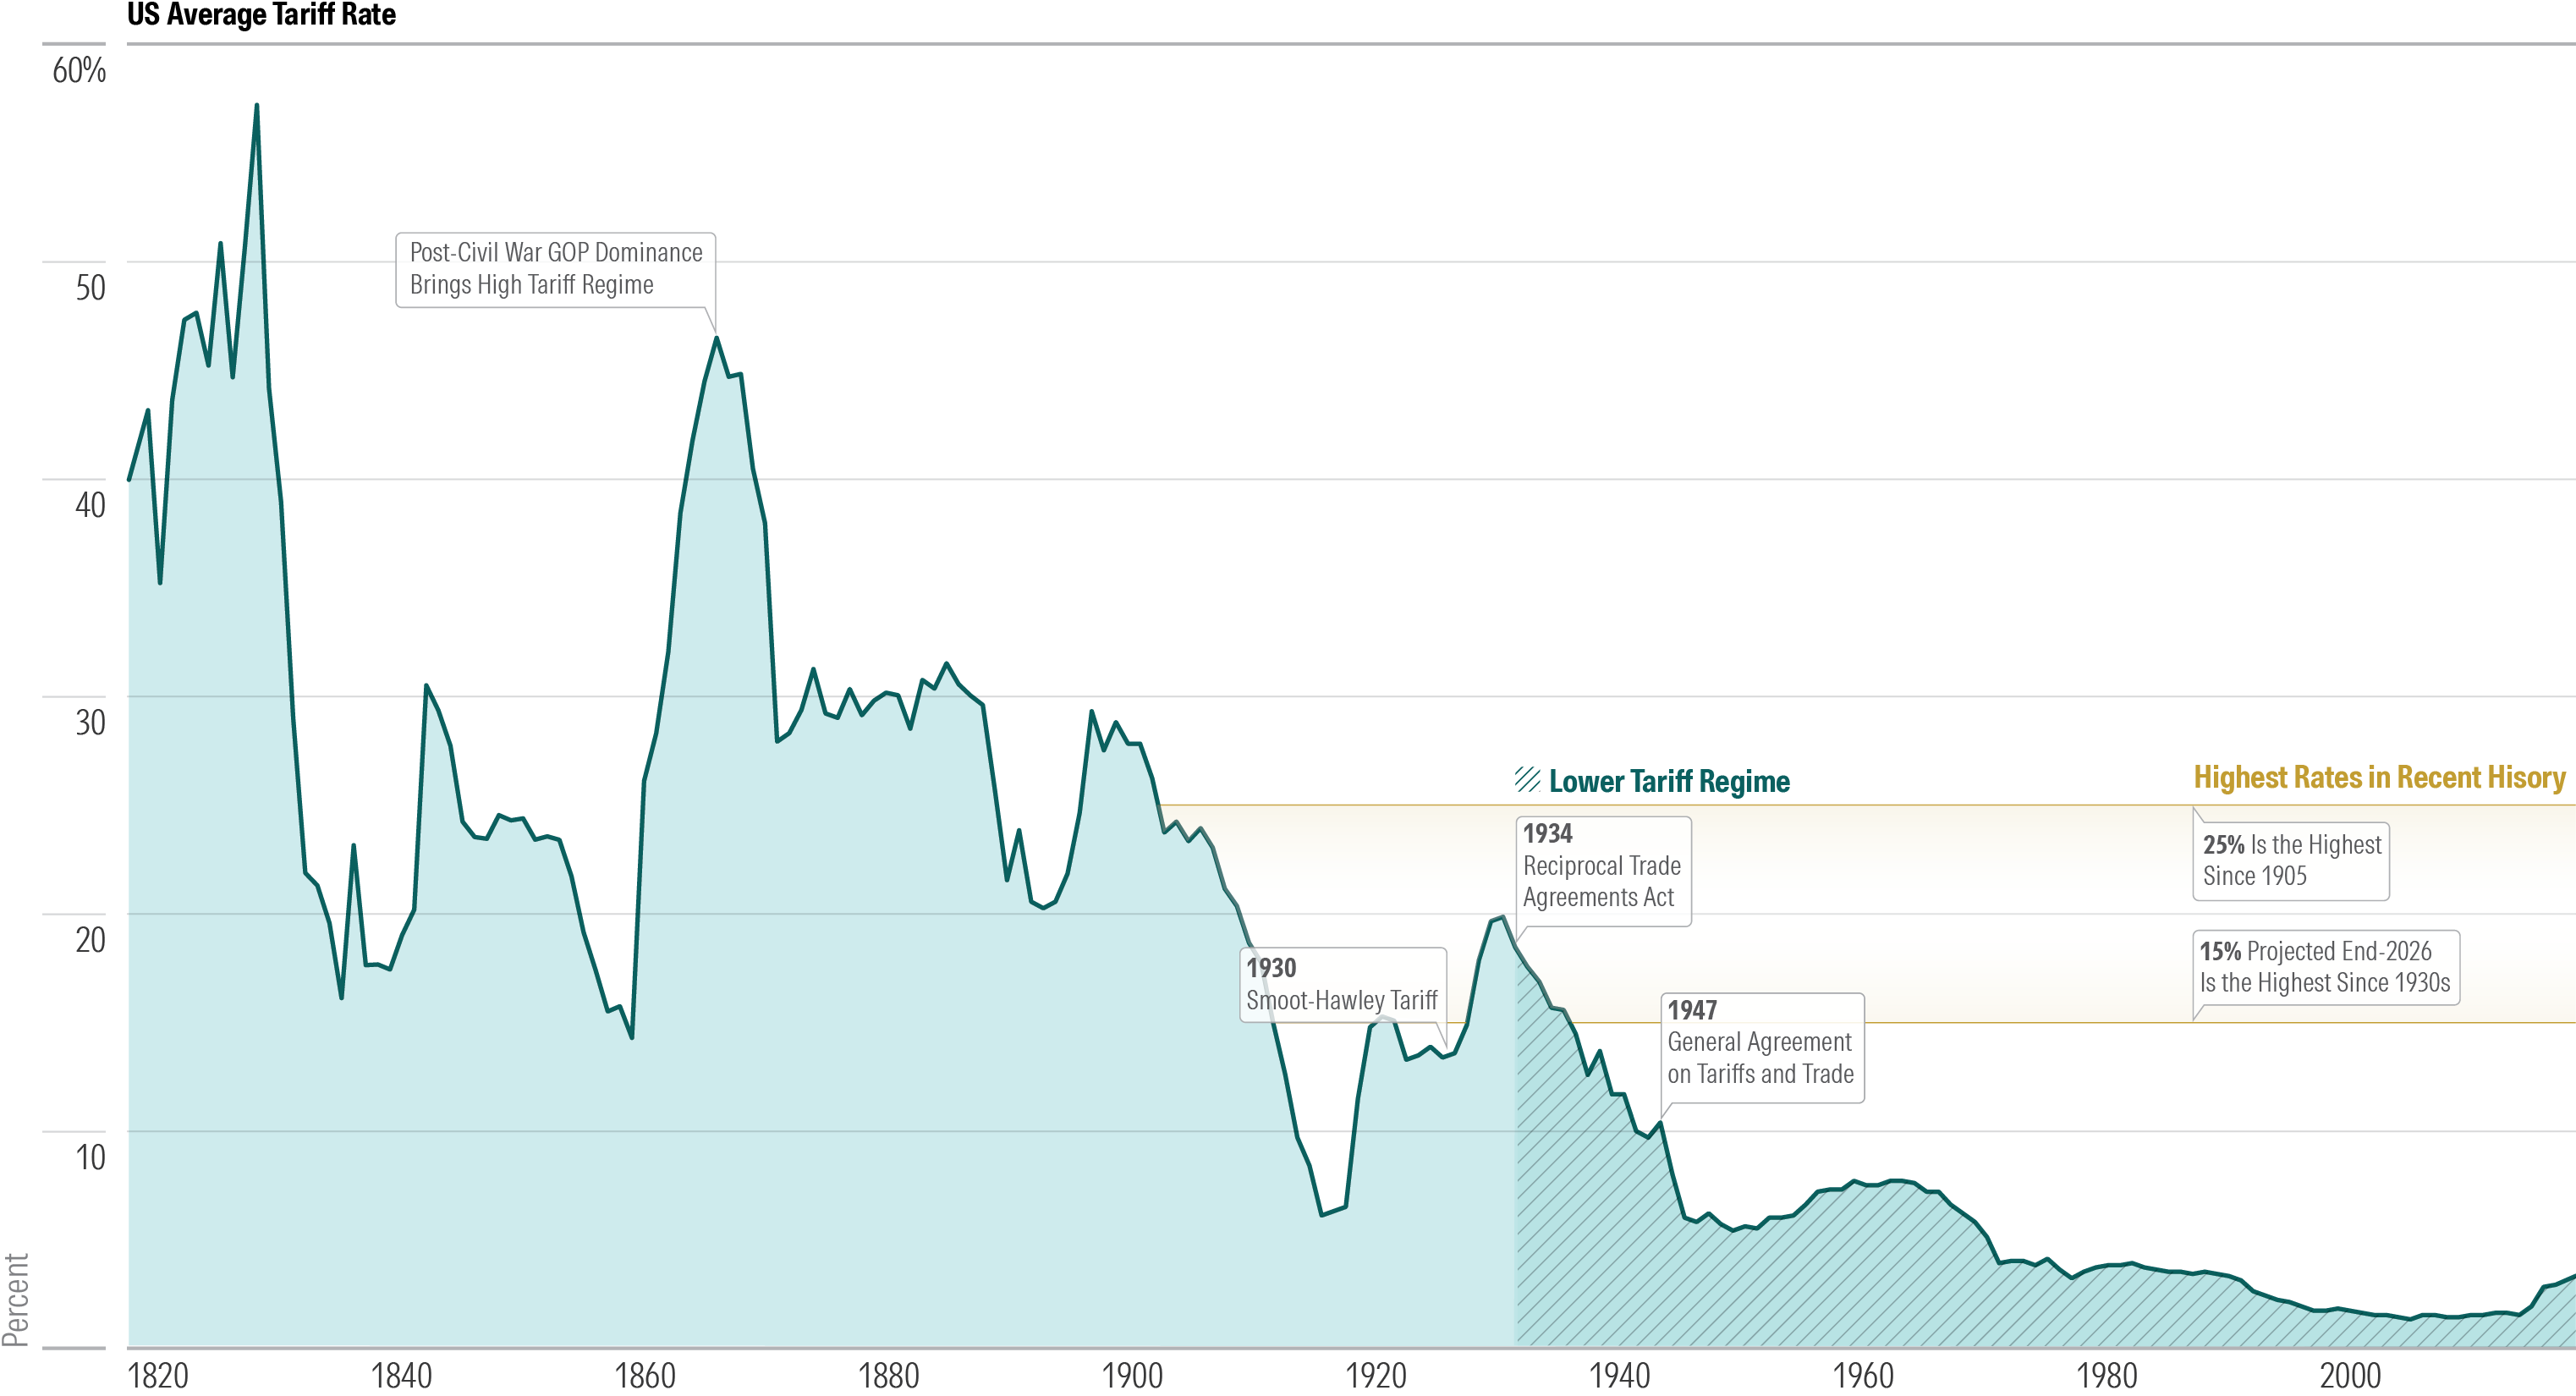
Low tariff rates have been the standard for the US and most other major economies since the end of World War II. With all the tariffs now in place, the average US tariff rate has surged up to 25%, up 23 percentage points from 2024 and at the highest level since 1905. While some exemptions are expected, escalation is also possible. Caldwell projects the rate will still average 15% by the end of 2026, higher than any level seen since the 1930s. Adding another risk is the fact that economies are far more interconnected today than in that bygone era. For comparison, US imports were just 3.7% of GDP in the 1930s but were 14% in 2024.
US Average Tariff Rate Throughout History
Tariffs Unlikely to Fix Imbalances in Current Account
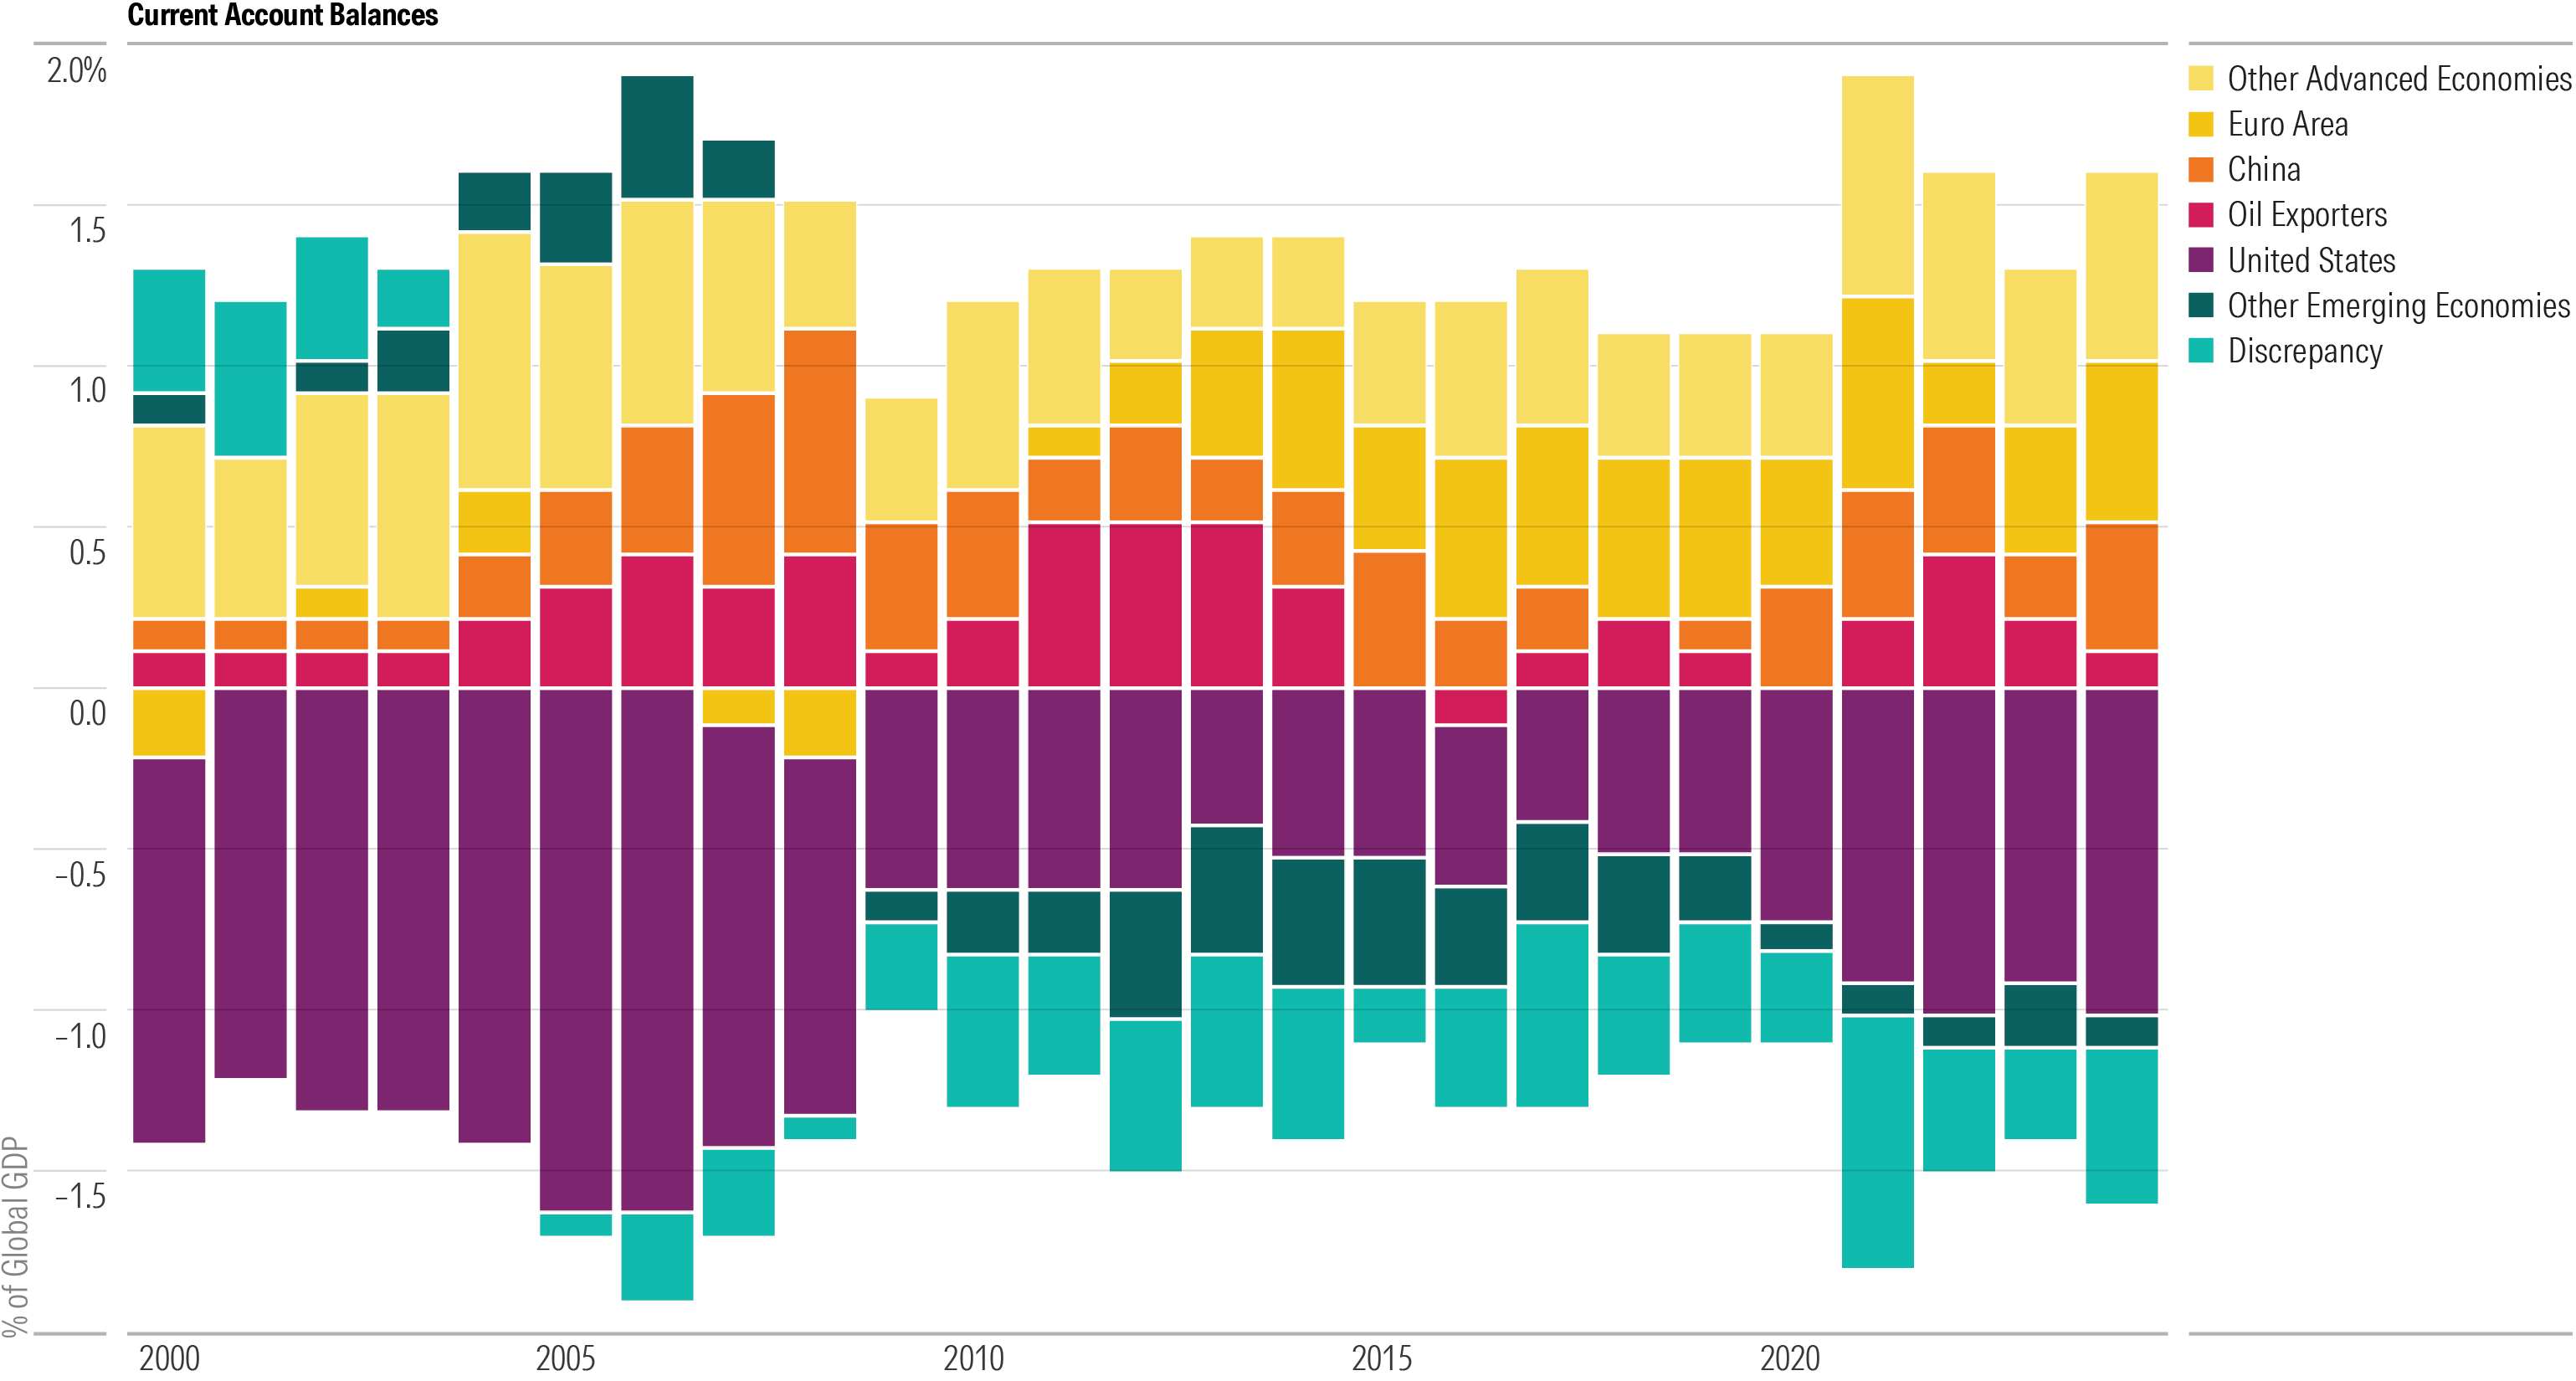
One of the key stated goals of US tariffs is to shrink the US trade deficit, the largest component of the current account deficit. The US did make progress in reducing the current account deficit in the 2010s, aided by falling surpluses in China, oil-exporting countries, and other emerging-markets economies. The US deficit then swelled a bit starting in 2020 owing to its comparatively strong domestic demand and exchange-rate appreciation.
Tariffs are unlikely to move the needle, as savings and investment behavior drive current account imbalances.
Current Account Balances
Economic Outlook: Darker Skies Ahead
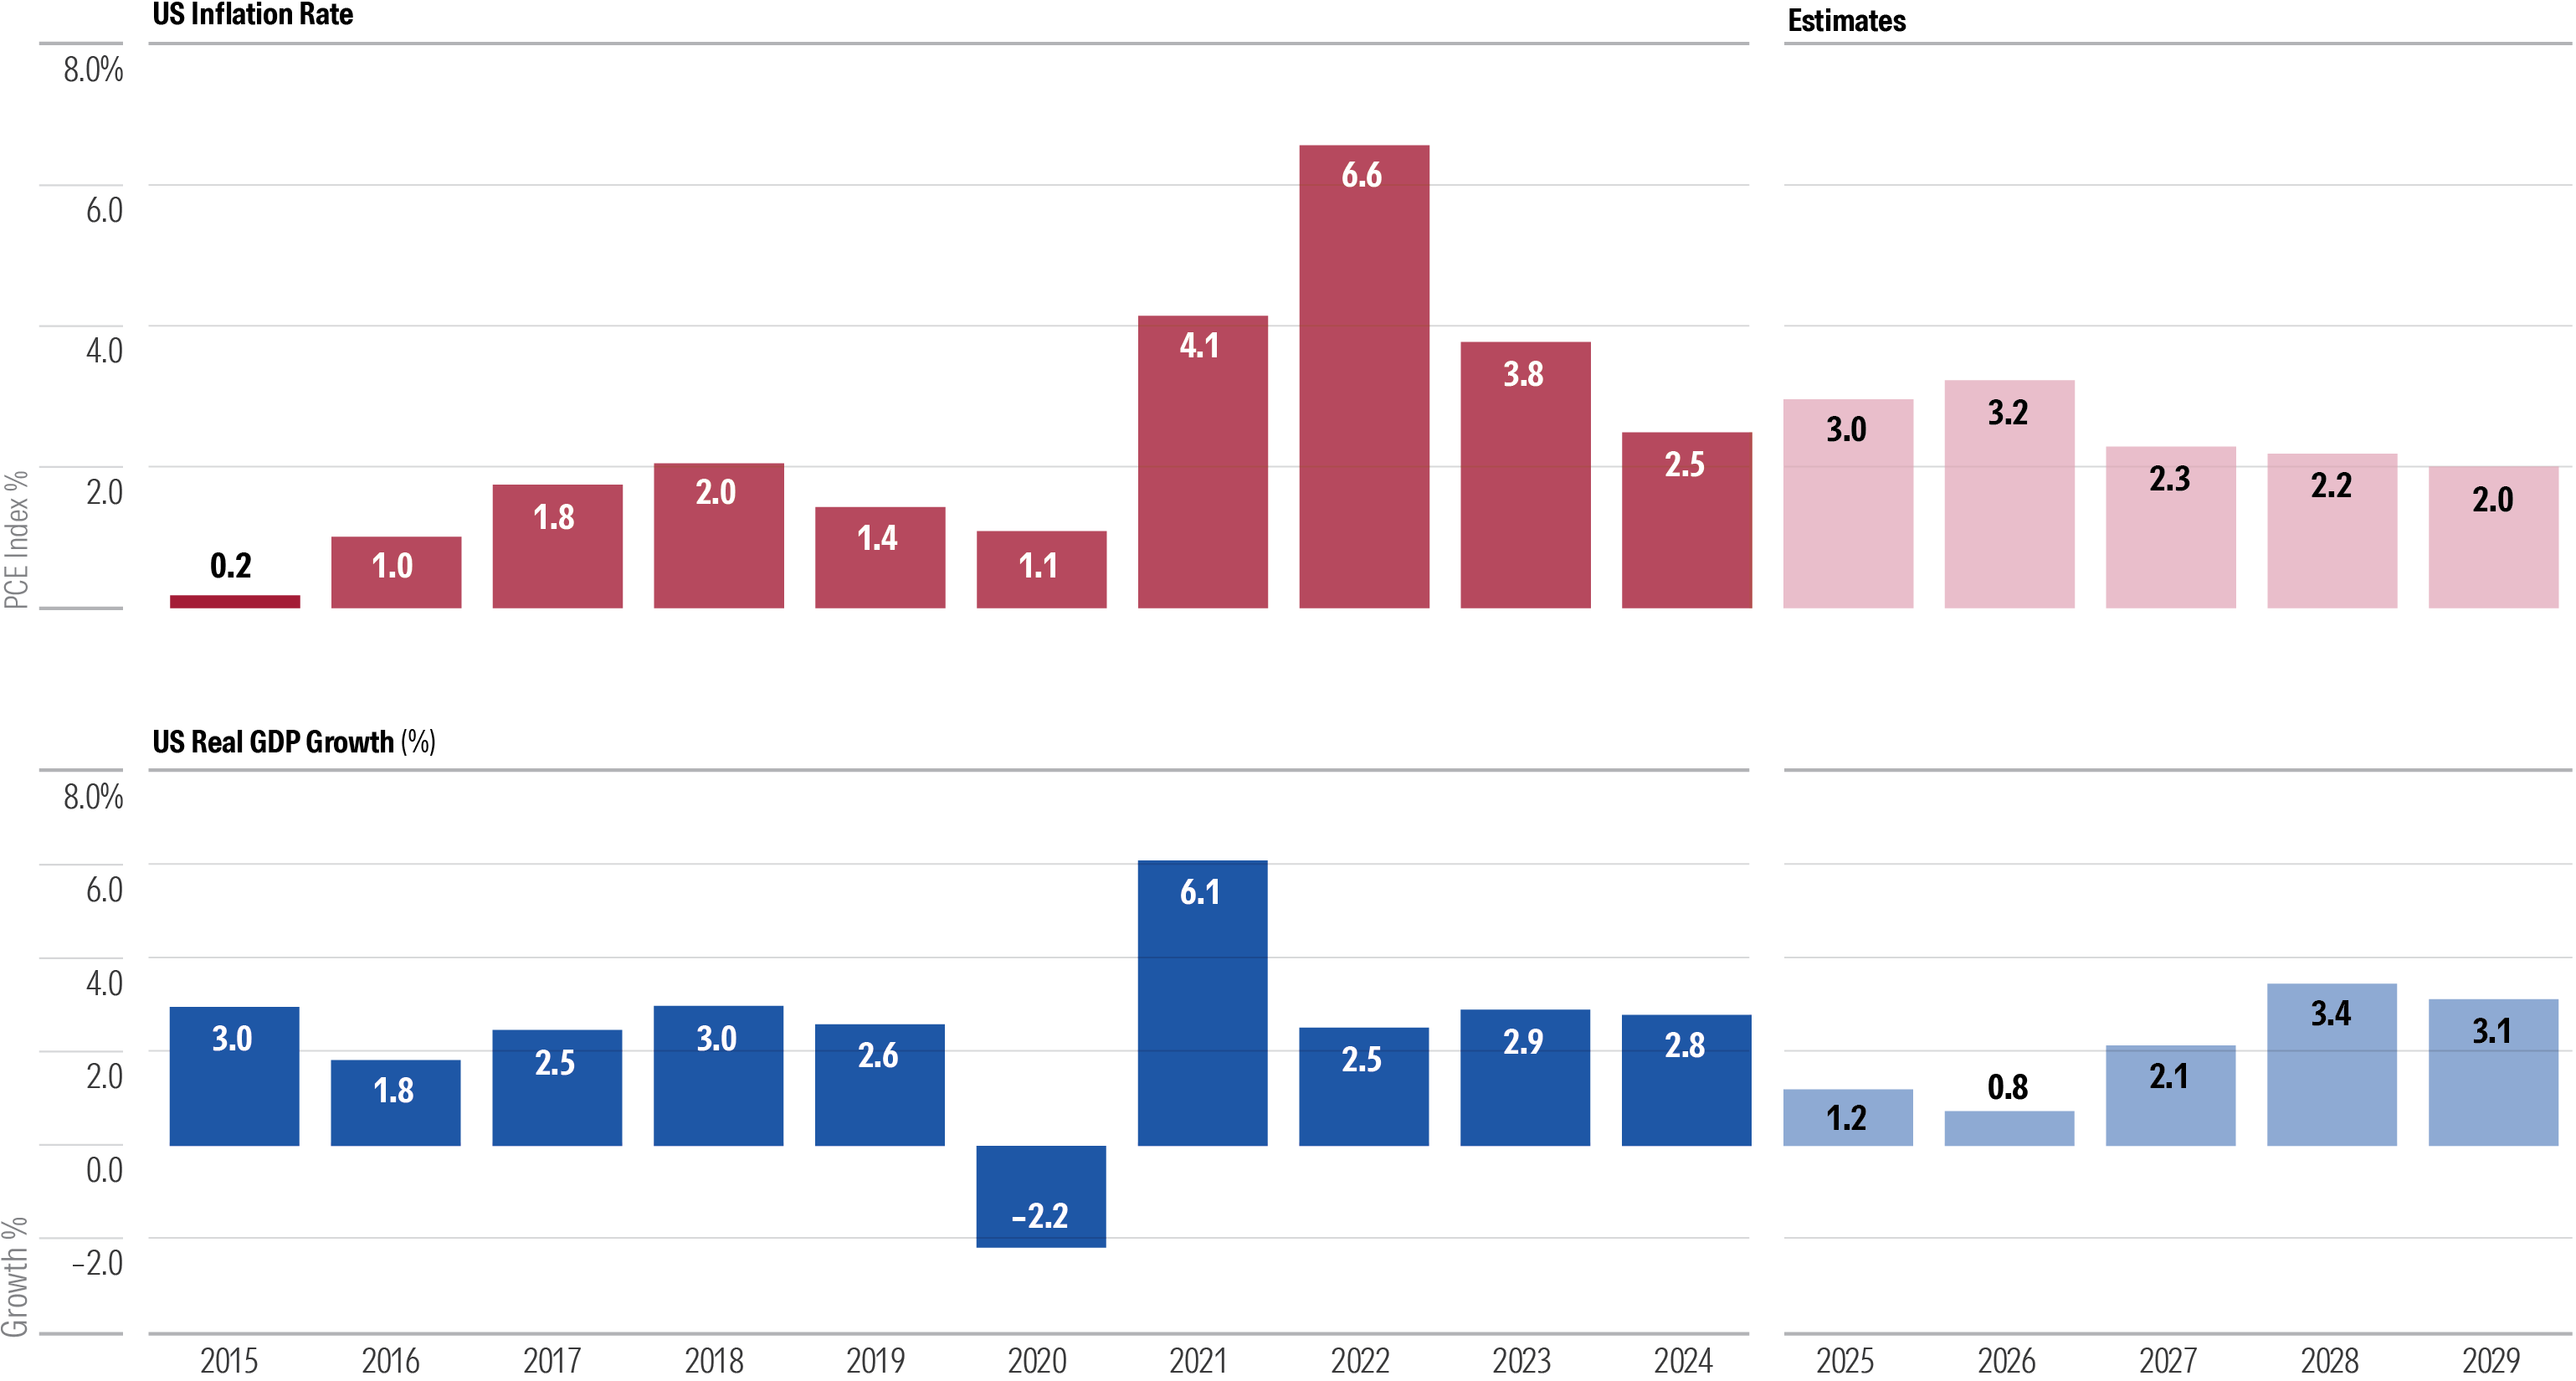
Tariffs are likely to set in motion a cascade of supply/demand shocks that will slow economic growth. Caldwell cut the real GDP growth forecast by a combined 1.6 percentage points over 2025 and 2026. Moreover, he places the odds of a recession in the next 12 months at 40%. Elevated tariffs are also likely to fuel inflation, delaying its return to the Federal Reserve’s 2% target.
US Economic Outlook Upended by Tariffs
Please see Caldwell’s latest US Economic Pulse report for more details.
The author or authors do not own shares in any securities mentioned in this article. Find out about Morningstar’s editorial policies.

 United States