
Investors Tend to Win No Matter Who Prevails in an Election
Plus, five charts on 2024’s third quarter.


Election season is underway in the United States. With each side painting dystopian visions of the future if their opponent wins the White House in November 2024, it’s important to tune out the noise and keep things in perspective. The US economy remains in good shape and the stock market tends to do well under both parties’ presidential terms.
Those are just a few of the many takeaways in Morningstar’s Markets Observer, a quarterly publication that draws on careful research and market insights. Preston Caldwell, Morningstar’s senior US economist, also digs into historical US trade policy and the impact of Republican candidate Donald Trump’s proposed tariffs on US gross domestic product.
Interested readers can download the full report here. Morningstar Direct and Office clients can also access the report on Direct Compass. A summary of key findings is available below.
US Economy Has Outperformed Since the Start of the Pandemic
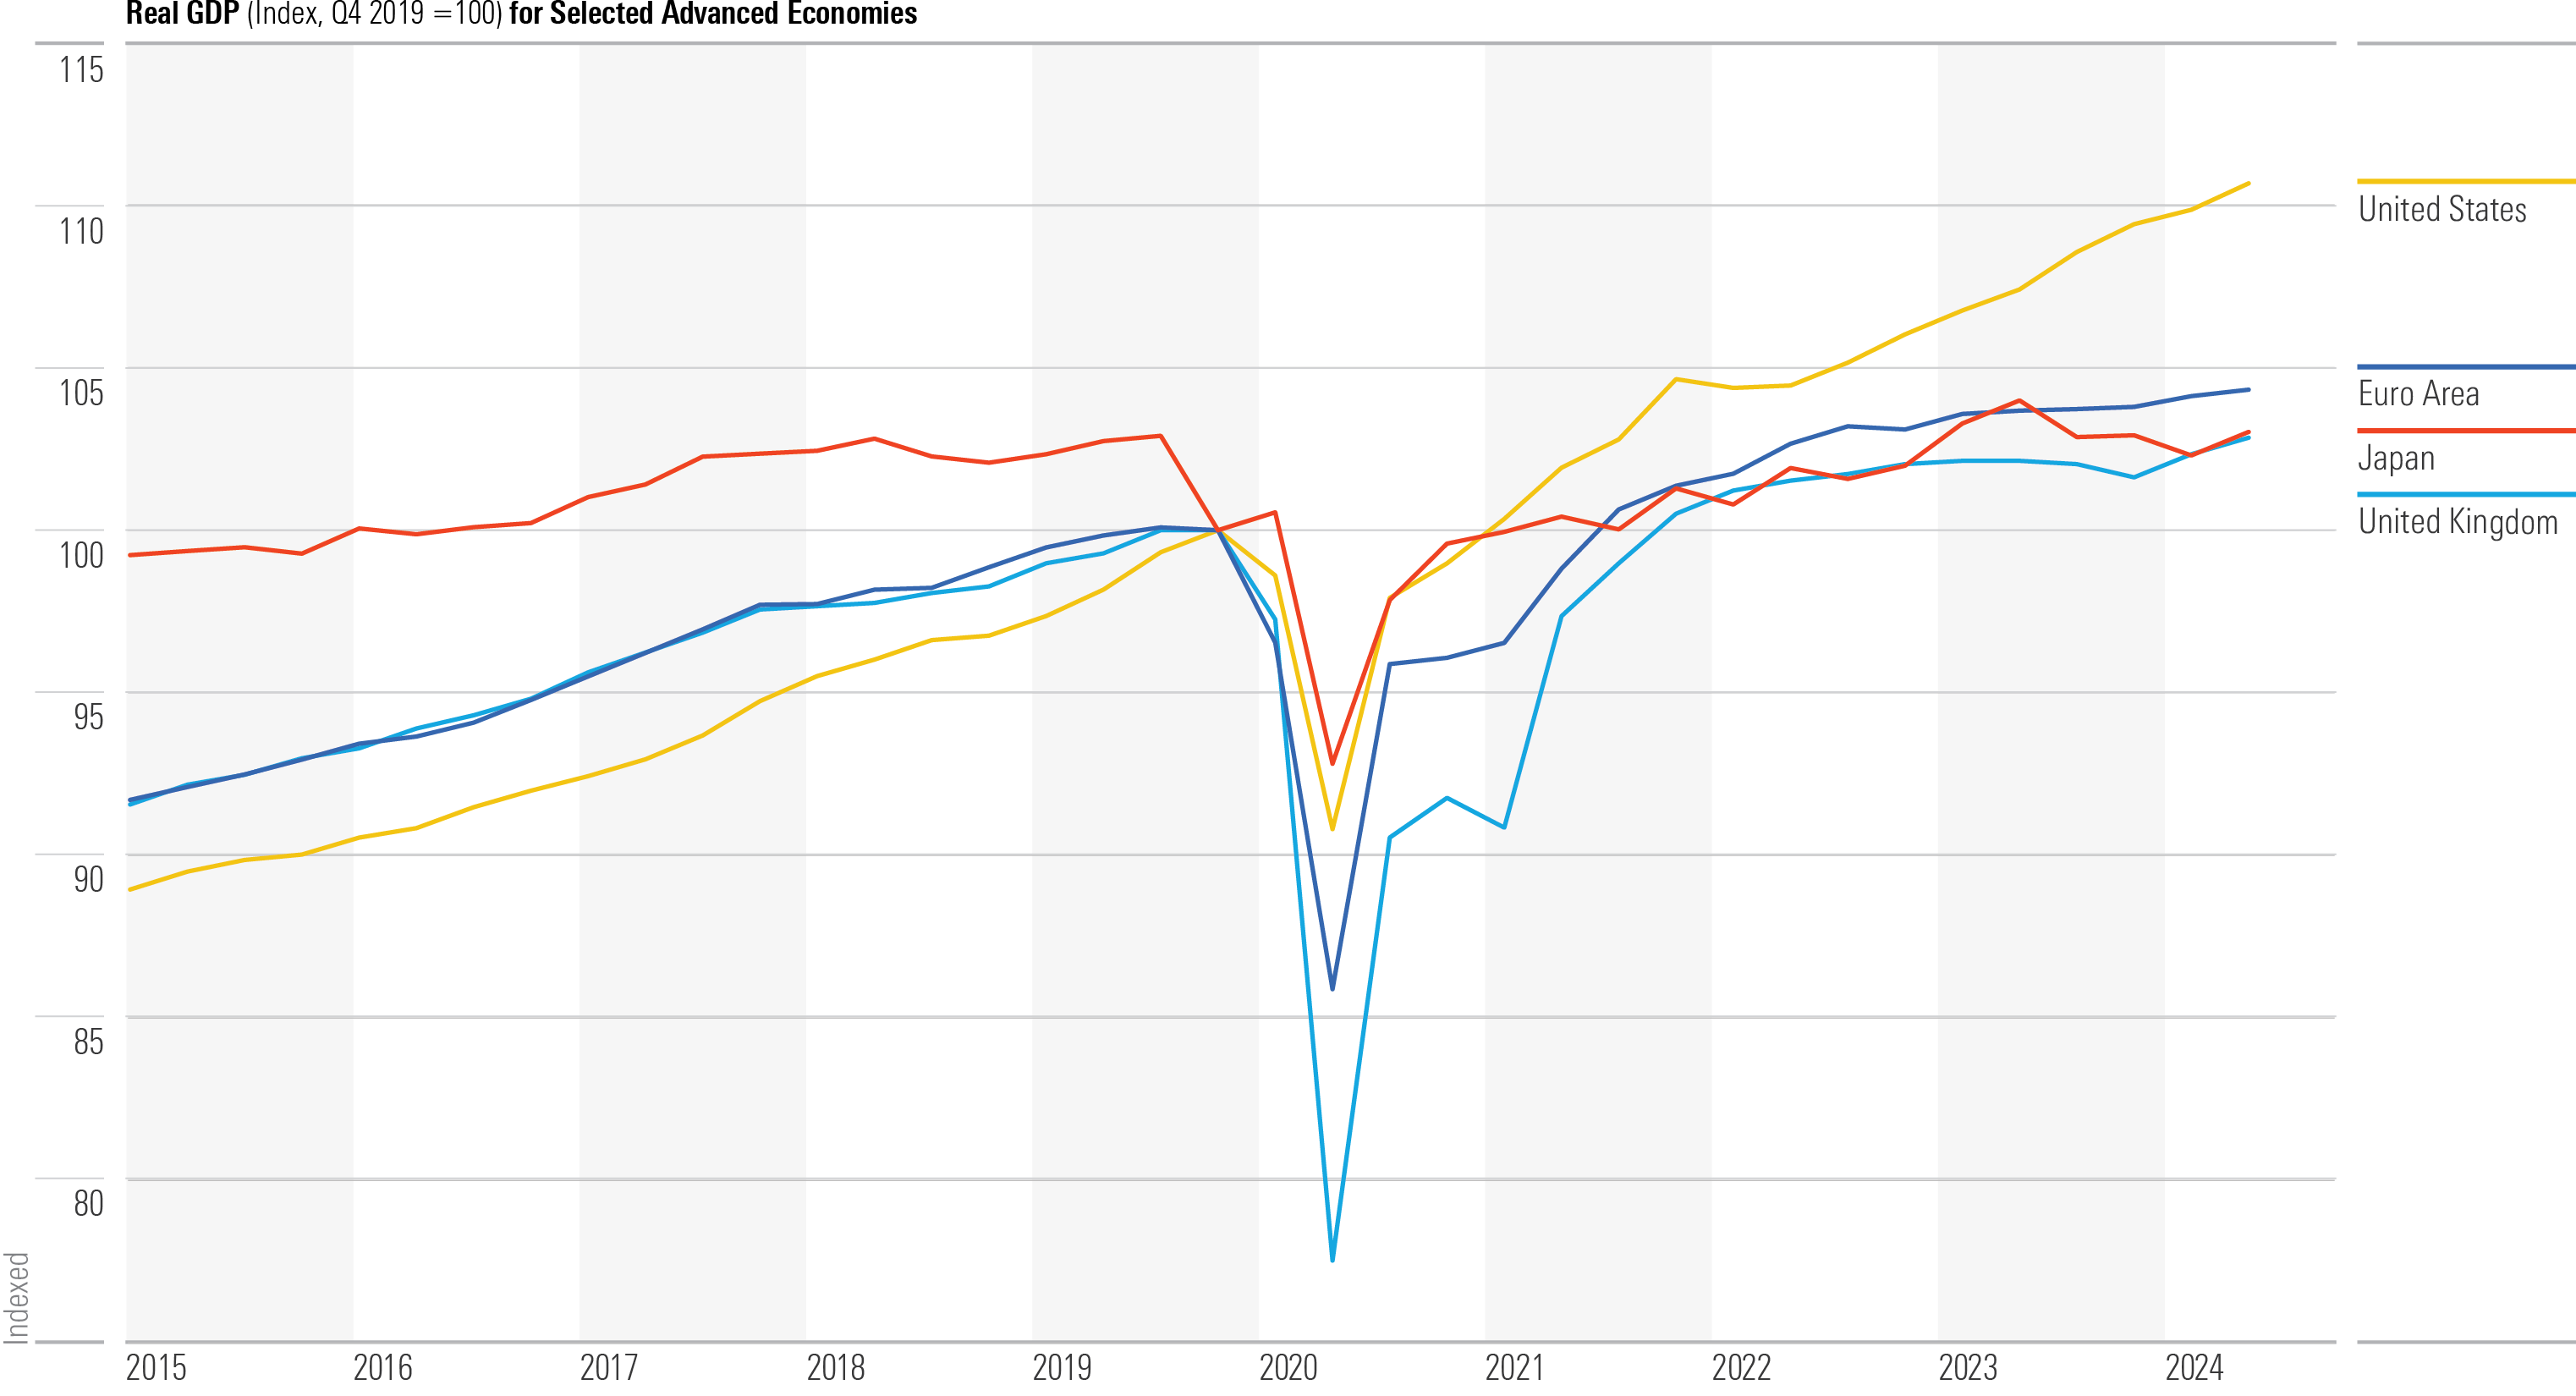
US real GDP has grown at a 2.3% average annual rate since the fourth quarter of 2019 through 2024’s second quarter, exceeding what most forecasters had projected on the eve of the pandemic. The US economy has soared past other major advanced economies over that time frame. Each of these economies are running near maximum output, so the causes of the divergence are likely more on the supply side than the demand side. Productivity growth has been impressive in the US.
Real GDP (Index, Q4 2019 =100) for Selected Advanced Economies
Inflation Is Marching Back to Normal
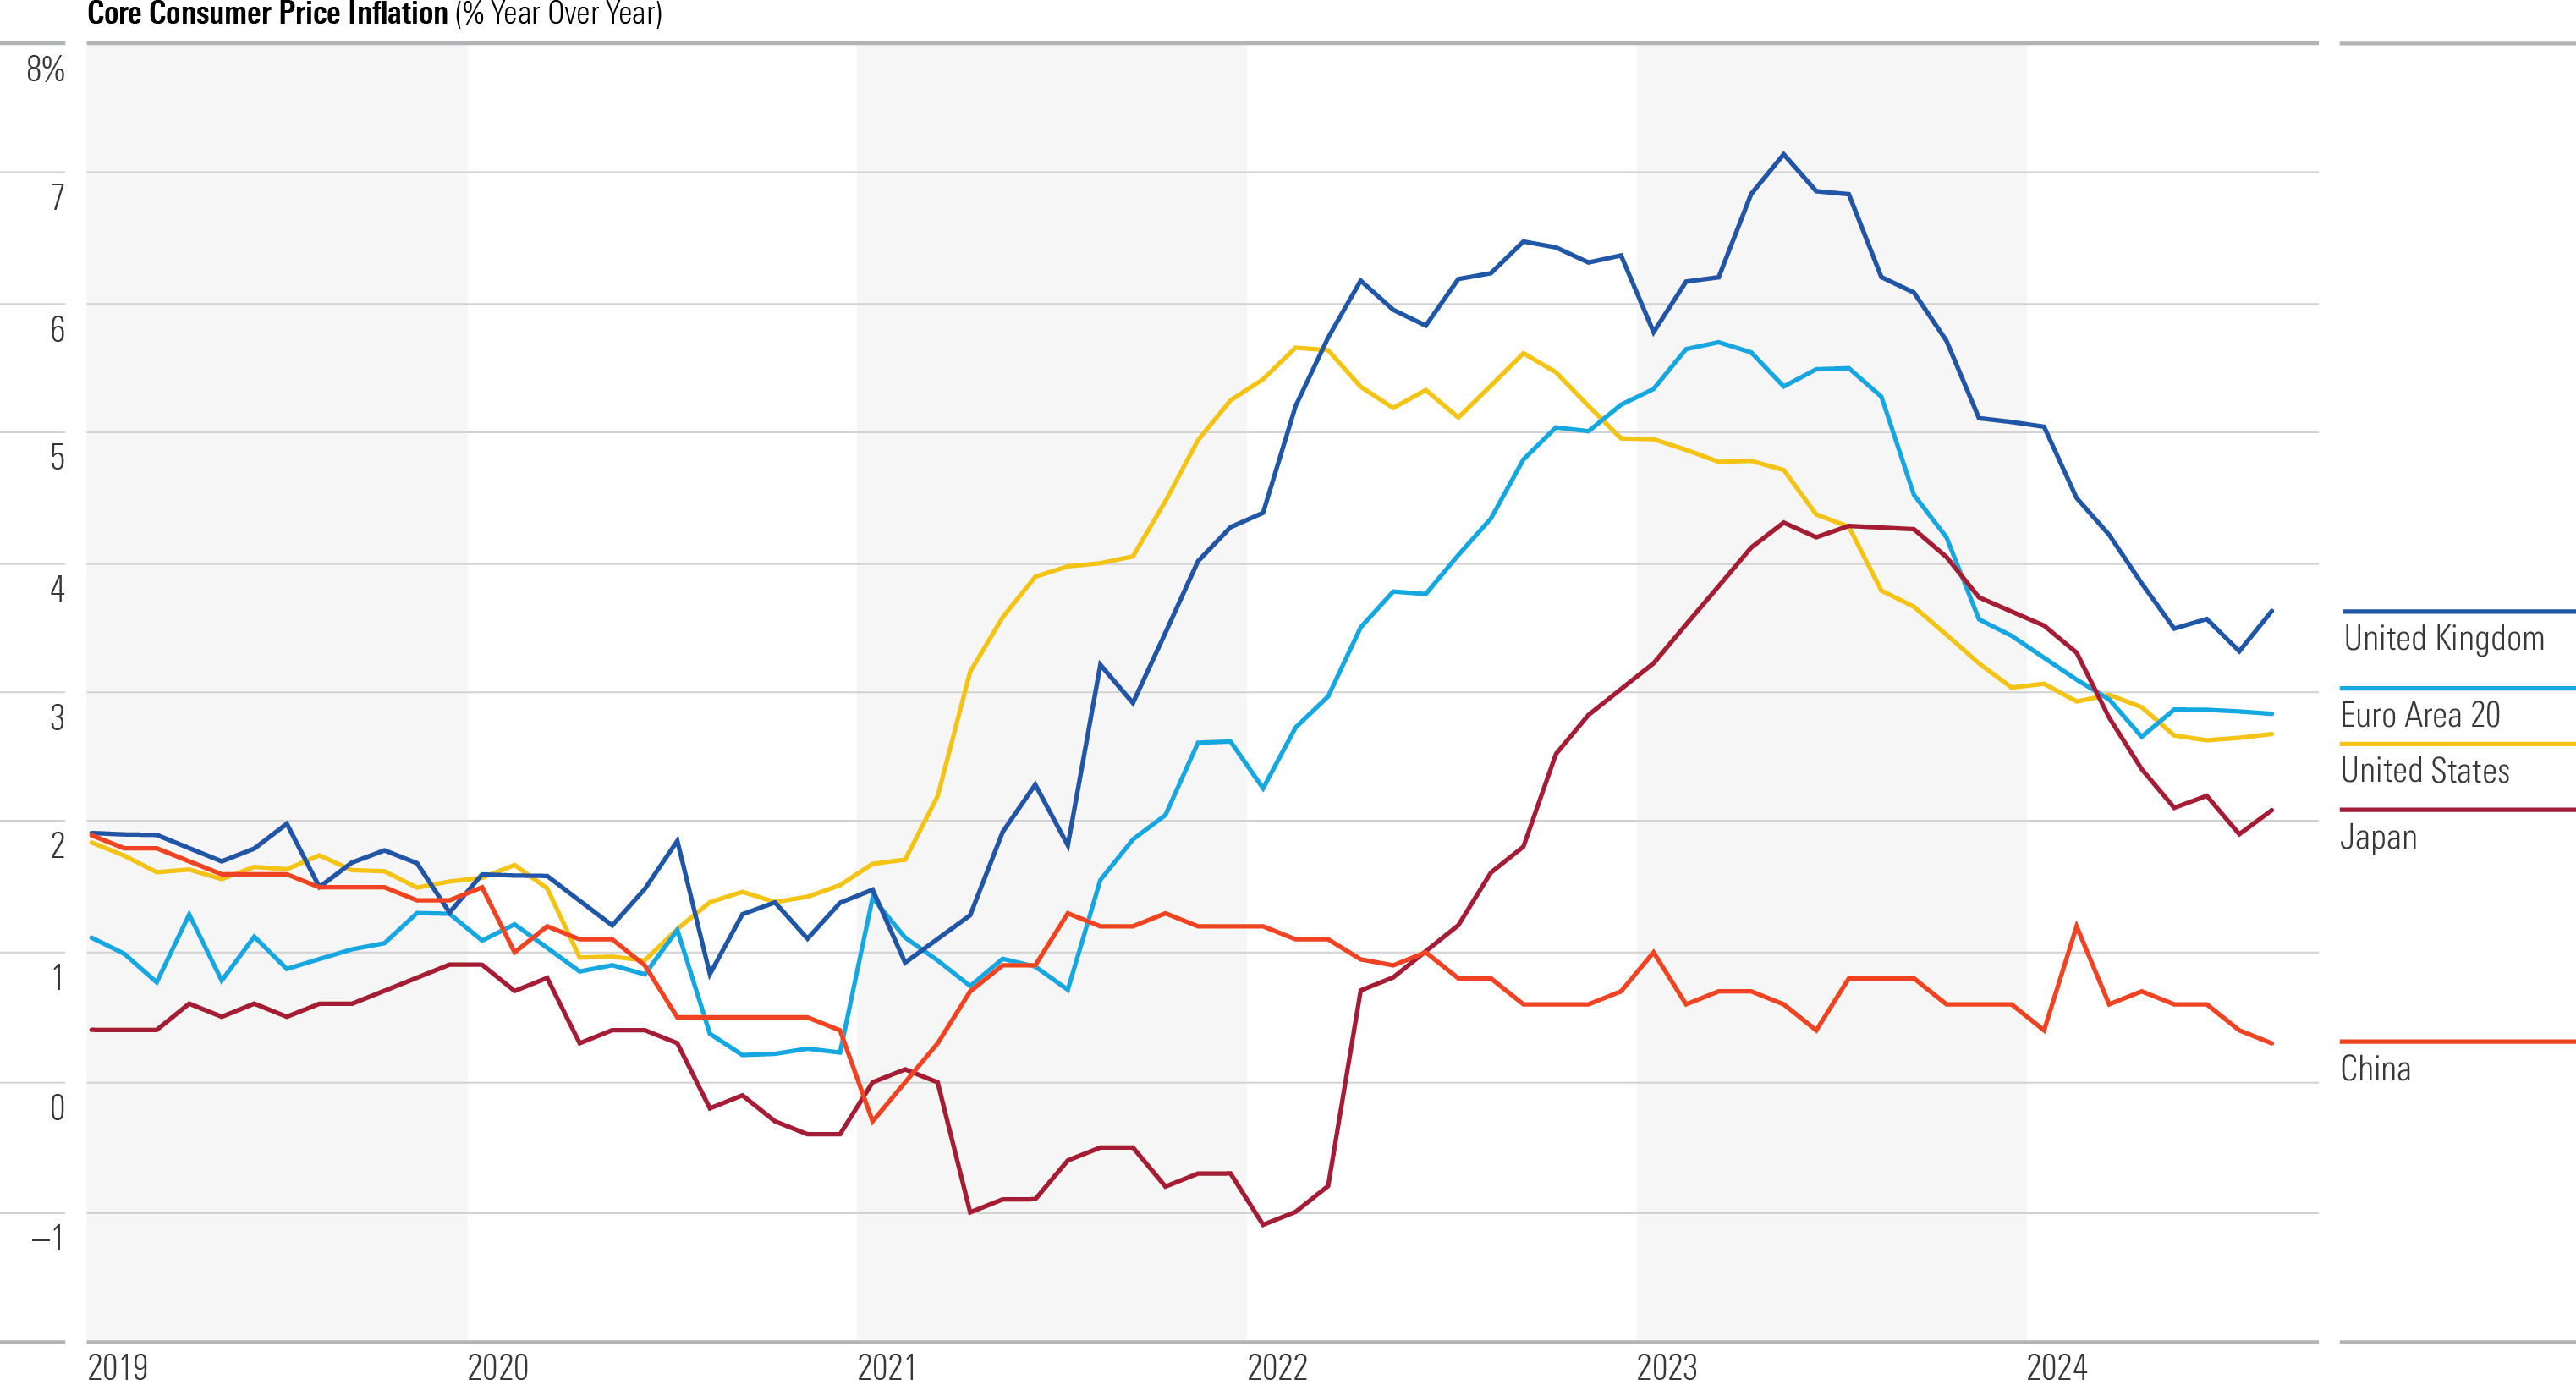
Core inflation for most major economies has receded greatly after peaking in 2022. We’re not quite at the point to declare “mission accomplished” in the battle against high inflation, says Caldwell, but it’s close. Inflation should continue to normalize as supply disruptions are resolved and demand cools off. China could also transmit its low inflation to the rest of the world via expanded exports, but this could be met with protectionist backlash.
Core Consumer Price Inflation (% Year Over Year)
Election Cycles: A Historically Wide, but Typically Positive, Range of Outcomes
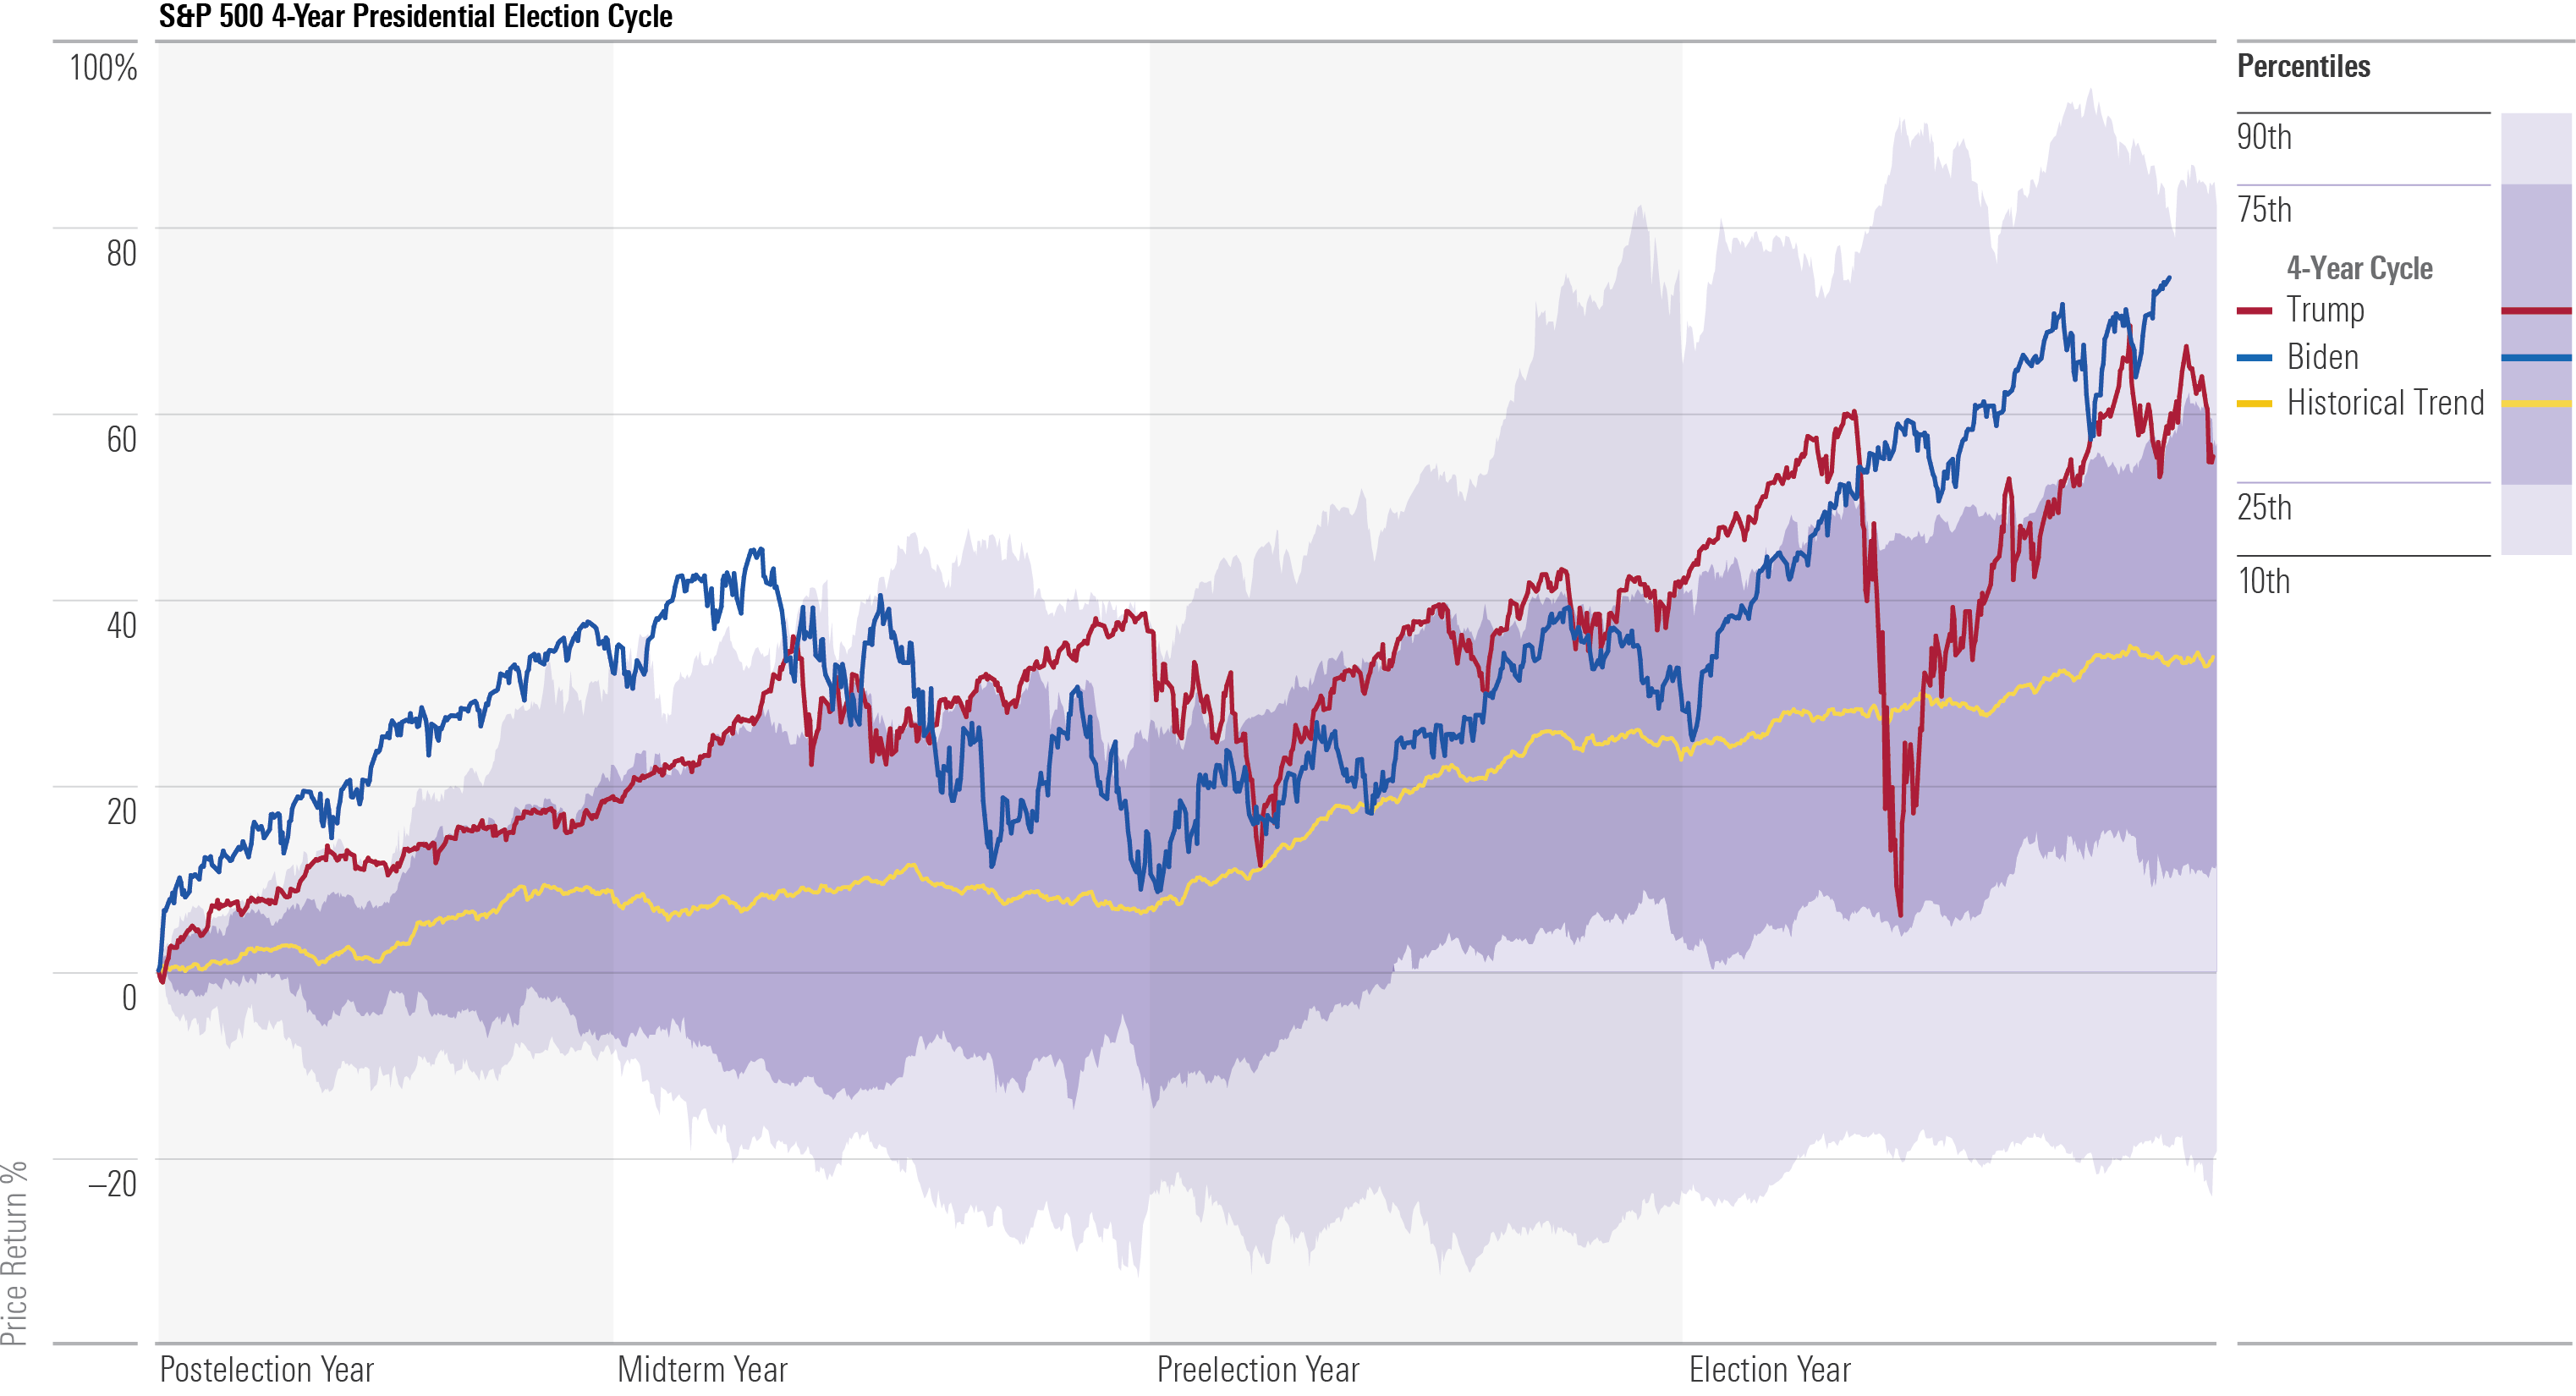
The below chart shows the distribution of daily price returns (that is, excluding dividends) for the S&P 500 index over four-year US presidential election cycles dating back to 1928. Starting Nov. 1 of each election year through Oct. 31 four years later, the average index price return is a cumulative 34%, though there’s a wide range of outcomes. Both Trump (2016-20) and Biden (so far in 2020-24) oversaw returns well above the historical trend.
S&P 500 4-Year Presidential Election Cycle Returns
Elections, Political Parties, and Markets: A Mixed Bag
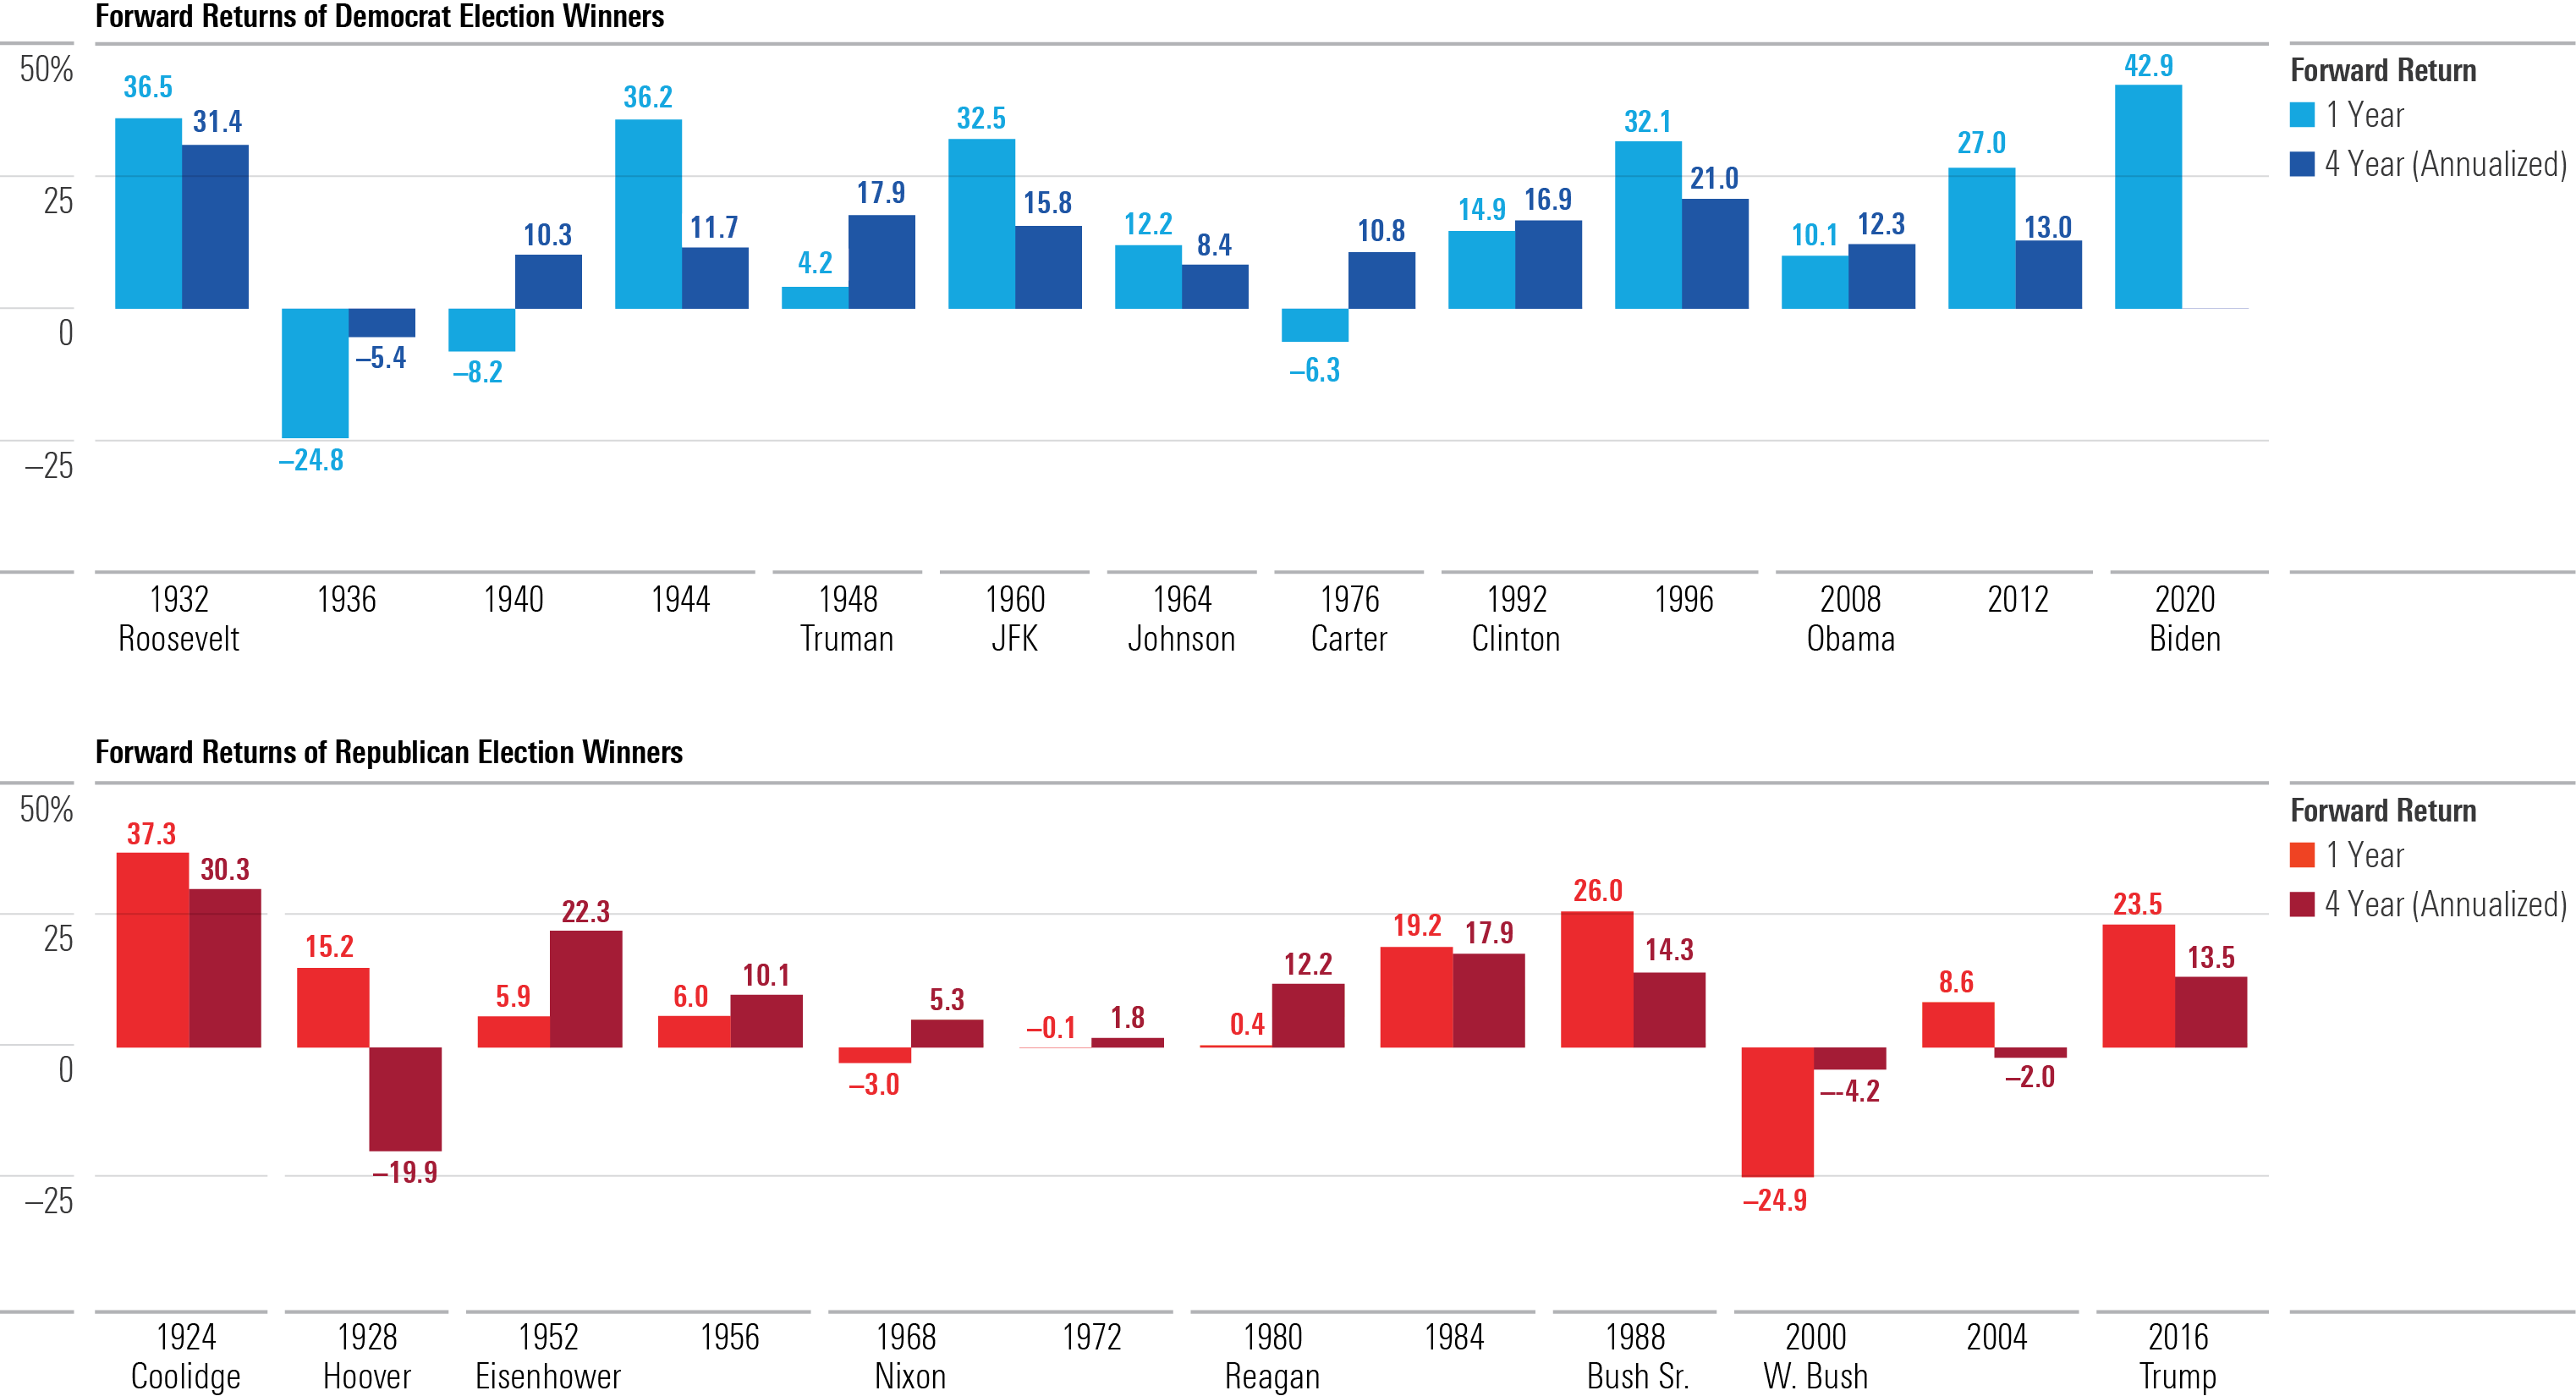
We sorted one- and four-year total returns for the S&P 500 index starting Nov. 1 for the last 25 US presidential elections. Forward one-year returns were positive in 10 of 13 Democratic-won elections, compared with nine of 12 of Republican-won elections. Over forward four-year periods, returns were positive for Democrats in 11 of 12 instances; for Republicans, it was nine of 12. Since November 2020, when Democrat Joe Biden won, the index was up 17.4% annualized through September 2024 (though Biden’s four-year returns do not appear in the below chart since his cycle hasn’t completed).
Forward Returns of Democrat and Republican Election Winners
High Tariffs Were Once the Norm for the US
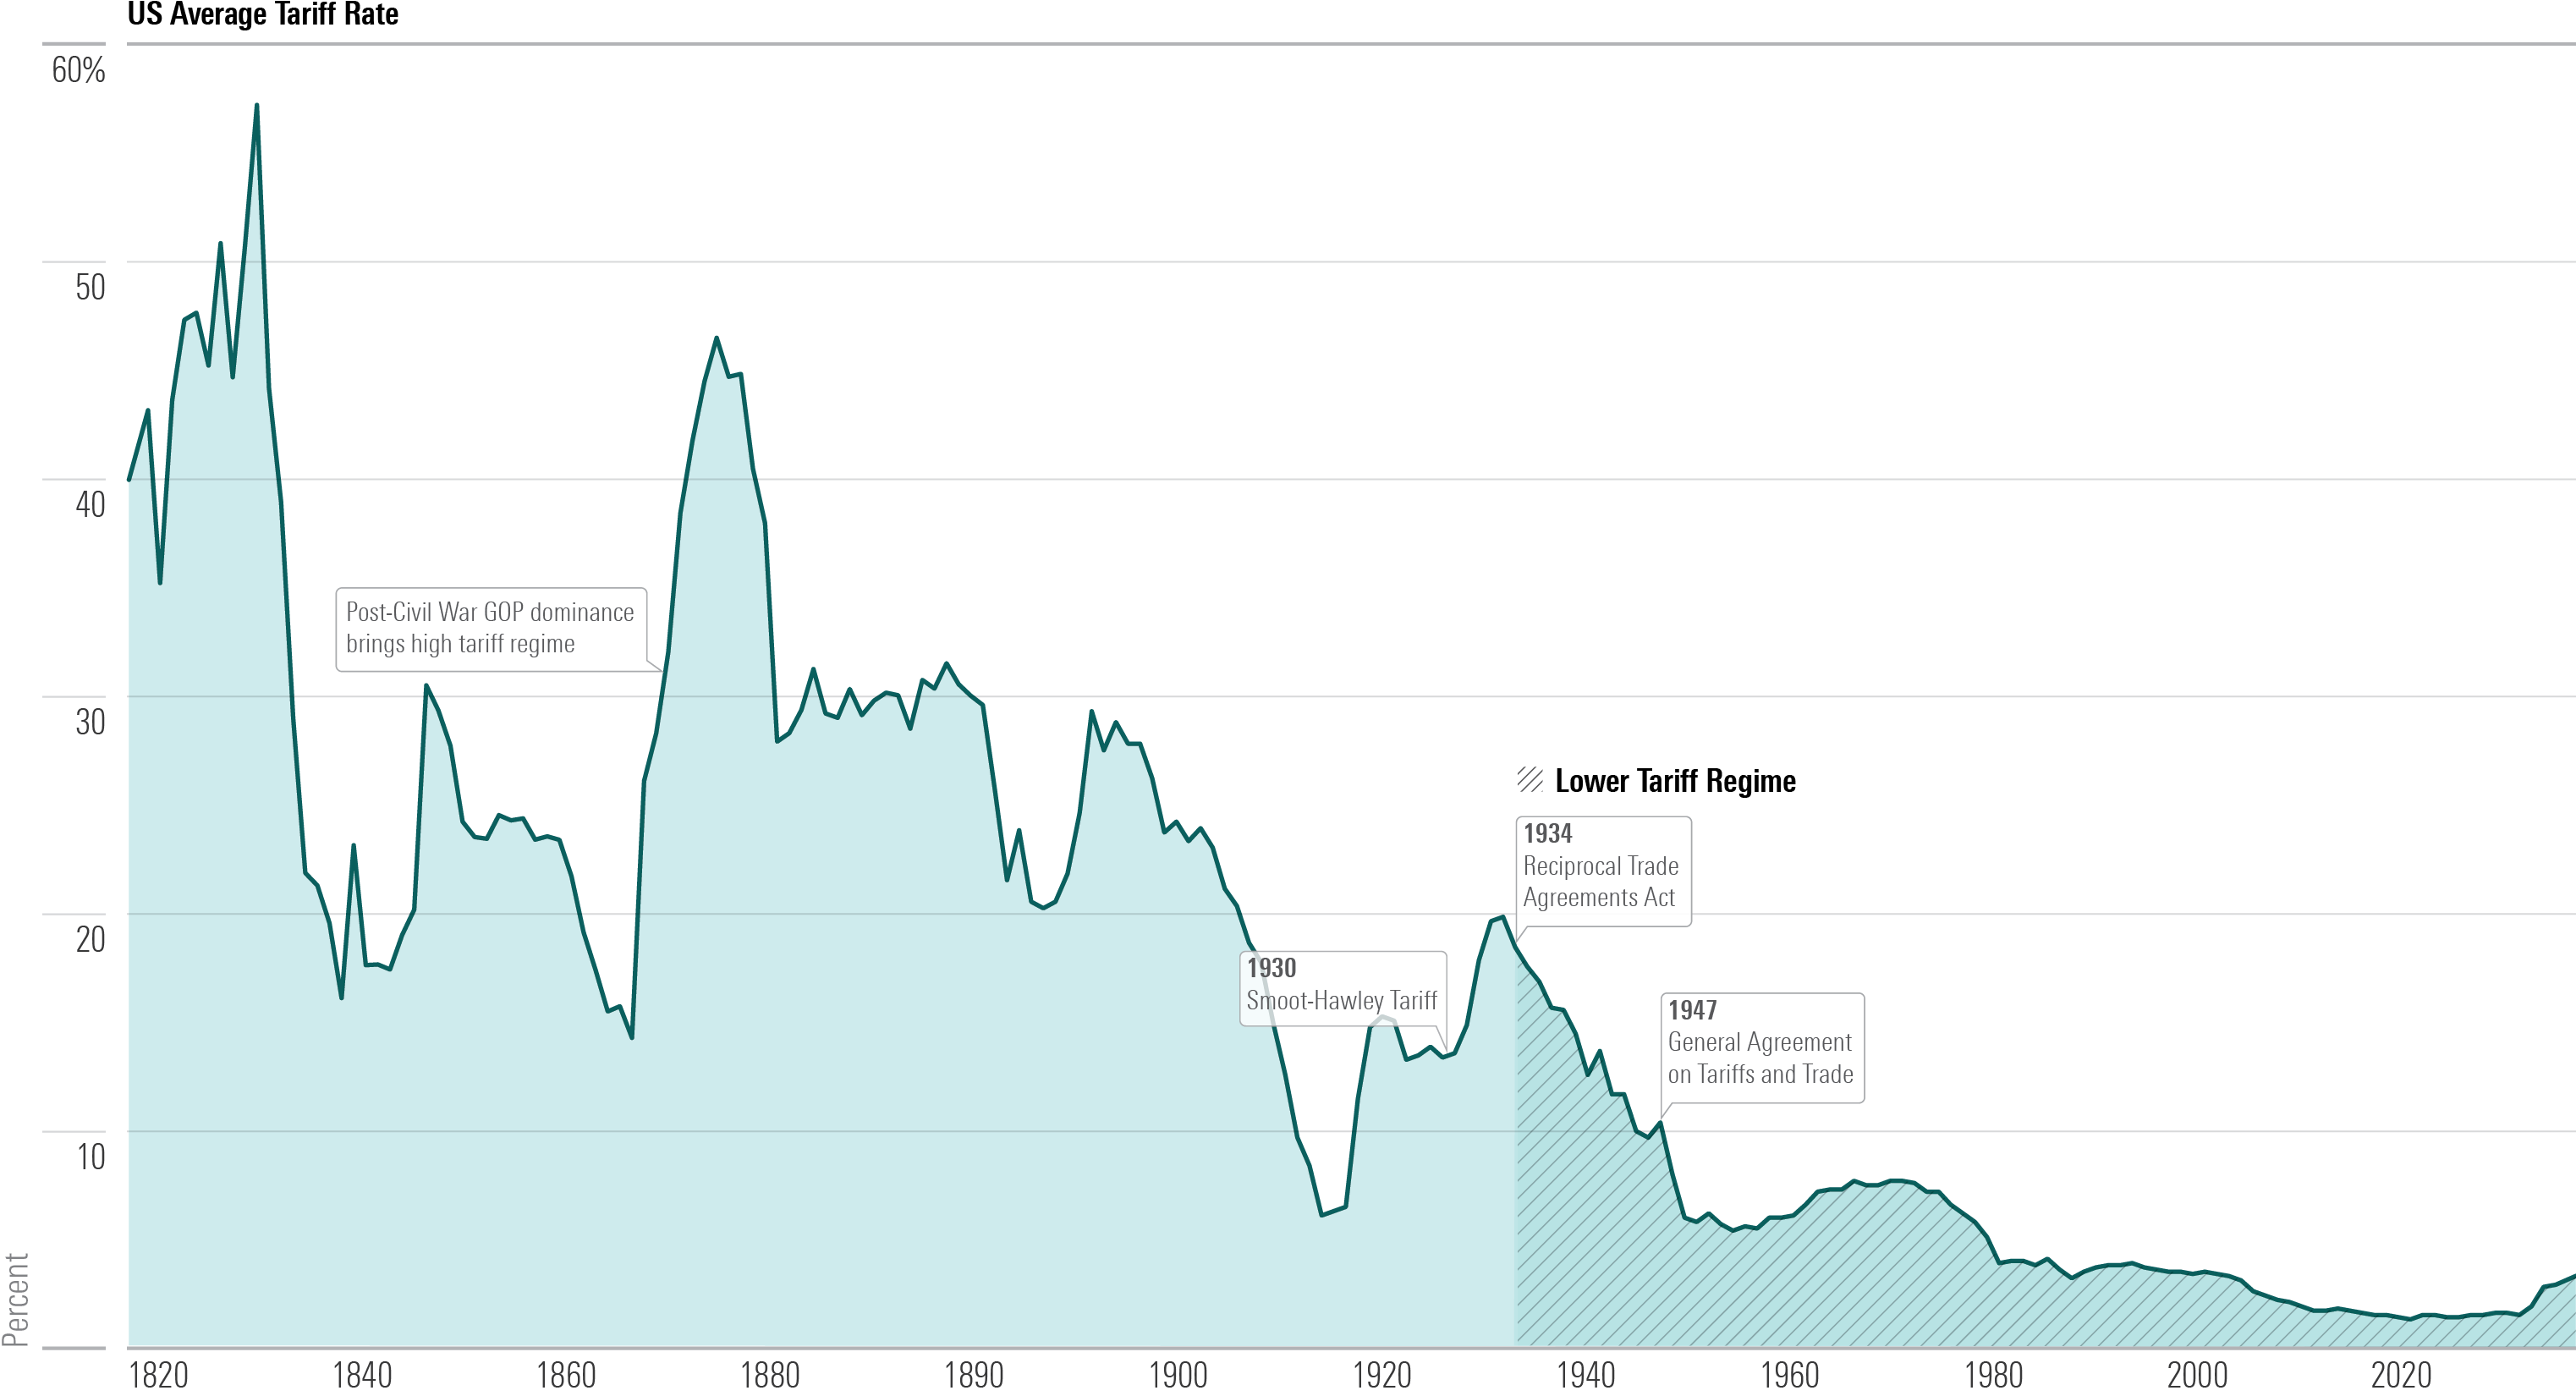
Low tariff rates have been the norm for the US and most other major economies since the end of World War II, but that hasn’t always been the case. From the second half of the 19th century to the early 20th, the US had very restrictive tariffs. One key lesson is that high tariffs, once they’re in place, are very hard to dislodge, owing to vested interests and the need for unified control over government. Douglas Irwin’s Clashing Over Commerce is a magisterial account of this history.
US Average Tariff Rate
Higher Tariffs Could Reduce US Real GDP
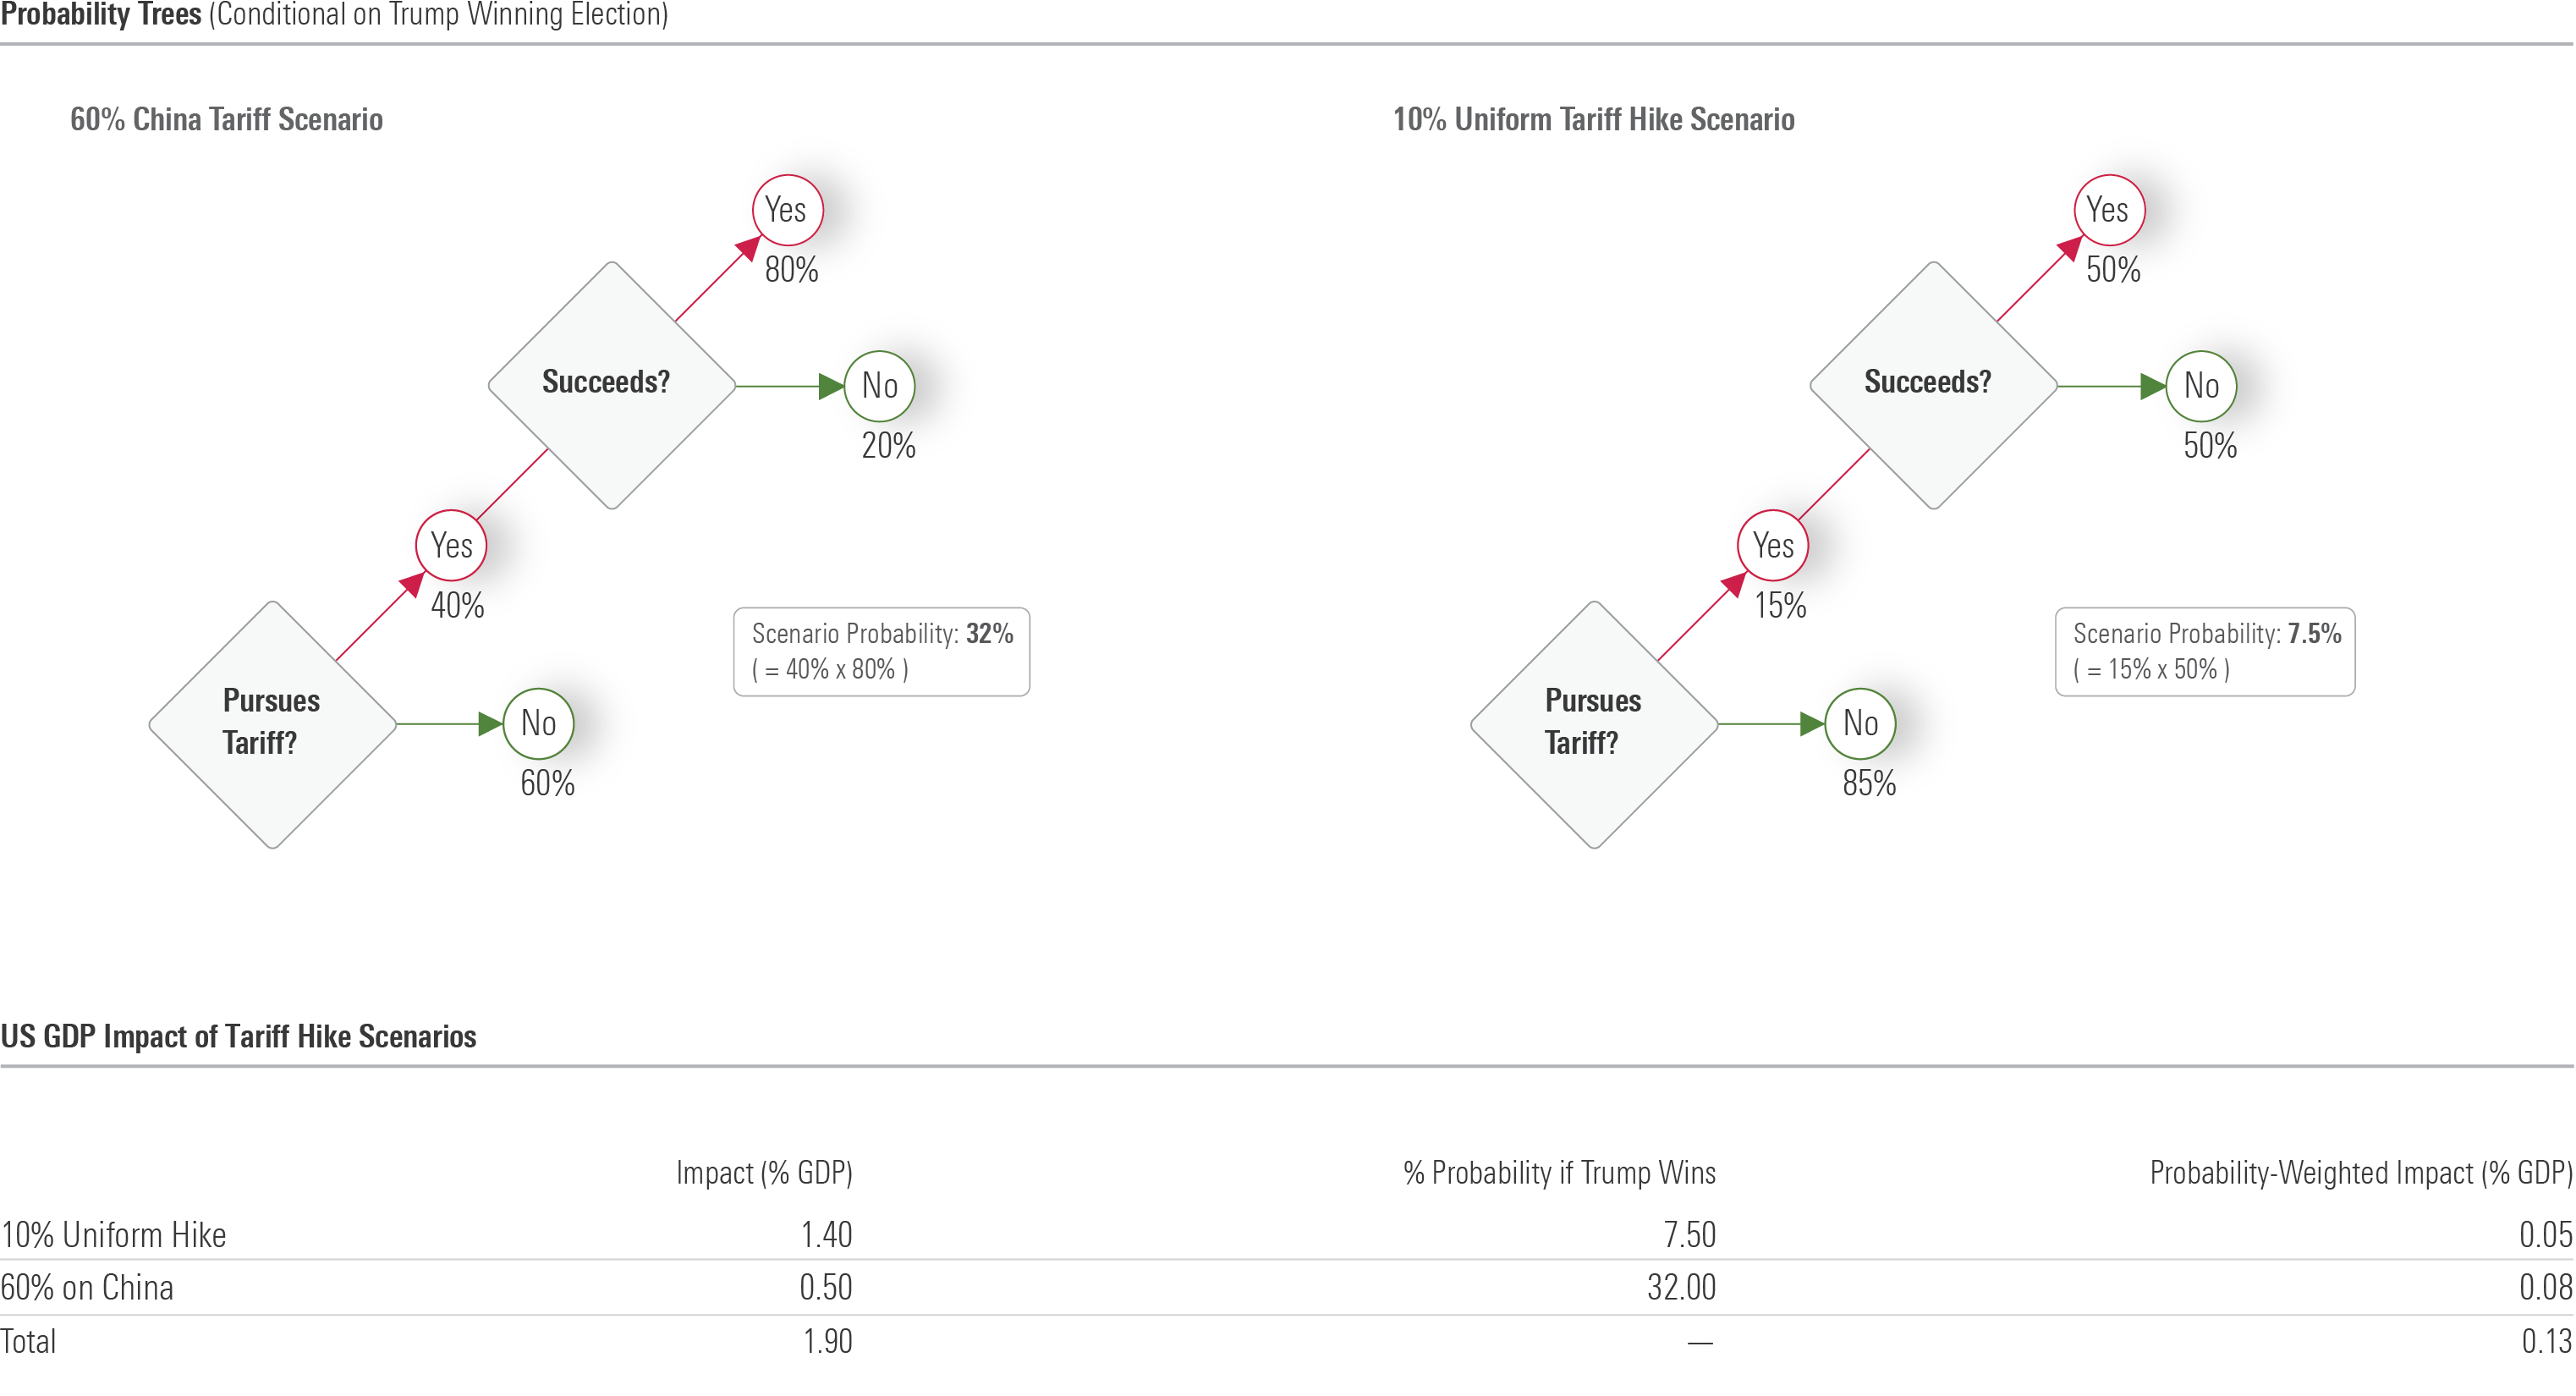
In contrast to most issues, US presidents can enact sweeping changes on trade without congressional approval. Caldwell estimates that Donald Trump’s proposed tariff hikes would subtract 1.9% from the long-run level of US real GDP. Still, he believes it’s more likely than not that Trump would back down from the threatened tariffs, particularly the 10% uniform hike. This leads to a probability-weighted impact of 0.13%. See Morningstar’s Q3 2024 US Economic Outlook for further details.
Probability Trees and Tariff Hike Scenario Analysis
Note: Senior US economist Preston Caldwell and associate investment analyst Joseph Weas also contributed to this article.
The author or authors do not own shares in any securities mentioned in this article. Find out about Morningstar’s editorial policies.

 United States