
11 Charts Examining the Racial Wealth Gap
What data tells us about the disparities along racial lines for income, savings, and overall financial well-being.


Racial inequality is a deep-rooted issue that affects millions of Americans in a magnitude of ways, including economically. While progress toward a more equitable country has been made, the racial wealth gap remains a stark indicator of systemic inequality.
Here we explore 11 charts that illustrate how wealth is distributed across different racial groups in the US, highlighting disparities in income, poverty, homeownership, savings, and student loan debt. This data reveals the wide scope of the issue.
Making strides toward improving these issues, let alone solving them, is far from simple. But a first step is acknowledging and understanding the magnitude of the problem.
Black Households Earn 64% of Median White Income
Though numerous factors contribute to the wealth gaps between demographics, one of the biggest contributors in the US is income itself.
As shown in the 2023 American Community Survey, the most recent study on this topic, conducted by the US Census Bureau, the median non-Hispanic white household earned just above $83,000. That’s compared with just over $69,000 for Hispanic households and just over $53,000 for Black households. The median household income for Asian households was greater than $111,000.
Median Household Income in the U.S. in 2023
This means that Black households earned the least overall, compared with non-Hispanic white households. Black households earned 64% of the median non-Hispanic white income, and Hispanic households made 83% of non-Hispanic white income.
Comparison of Household Incomes
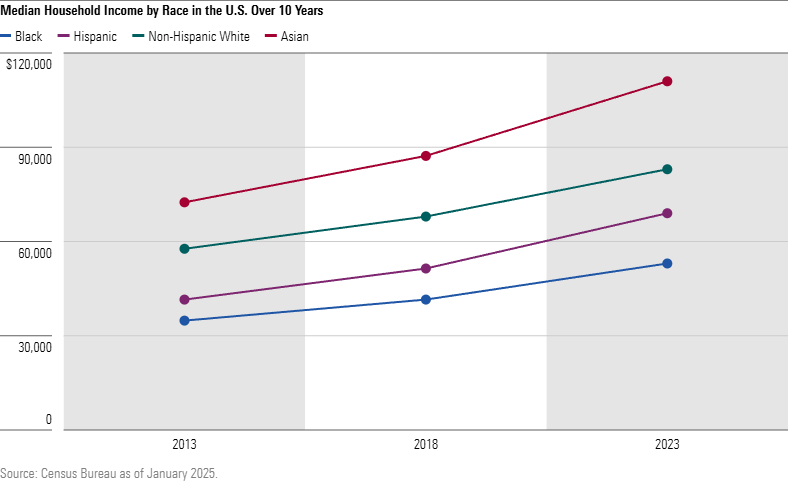
We also looked at how income by demographic has changed in the past 10 years by comparing median household income statistics from 2013 and 2023. In five years, median non-Hispanic white household income rose by nearly 26%, while Black household income rose 29%. While we can see an overall rise in income, the gaps between demographics remain stark. White household income rose from $55,000 in 2013 to over $83,000 in 2023, while Black household income rose from $35,000 in 2013 to just under $54,000 10 years later.
Median Household Income by Race in the US over 10 years
In the US, Black People Twice as Likely to Fall at or Below the Poverty Line
Factors like lack of access to education, the rising cost of living, and systematic barriers contribute to poverty for millions of Americans. According to the Census Bureau, the poverty threshold for a family of four was $32,355 in 2024. (Note that this figure is based nationally and does not factor in cost-of-living differences between states and cities.) The threshold for an individual over 65 years old was $15,045.
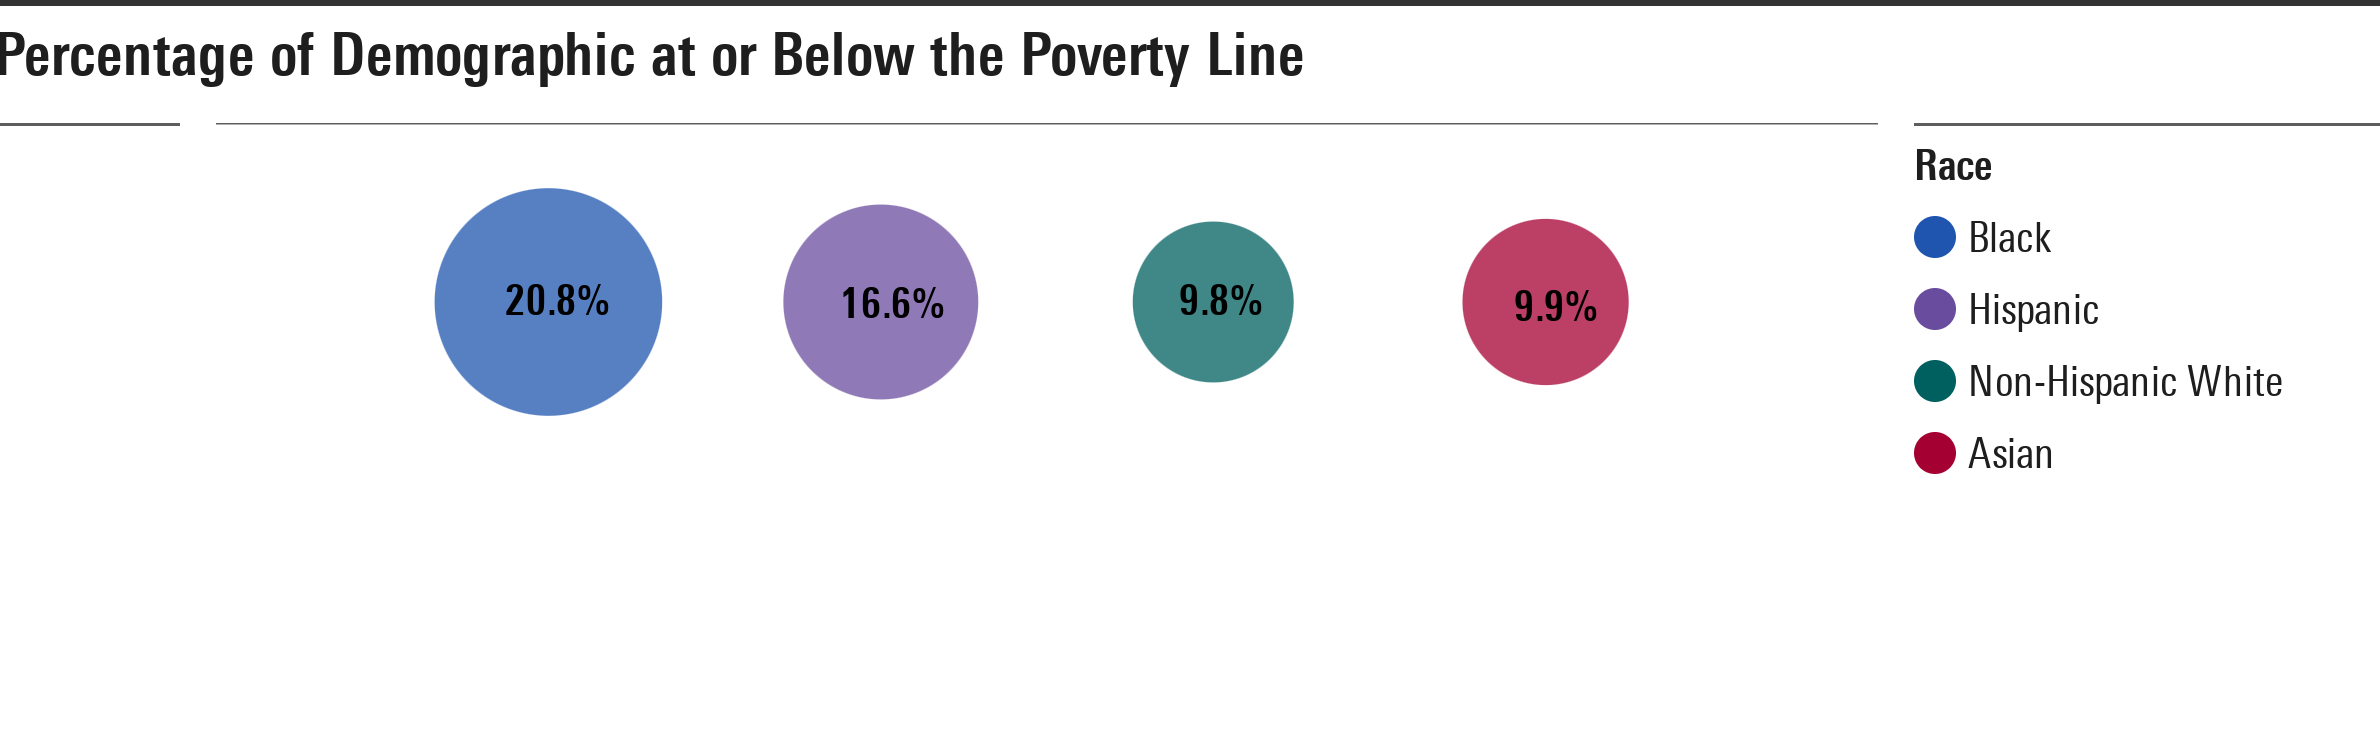
Based on the 2023 American Community Survey, Black people in the US are twice as likely to fall at or below the poverty line than non-Hispanic white people. In 2023, an estimated 20.8% of African Americans and 16.6% of Hispanic Americans fell at or below the poverty line, compared with 9.8% of white and 9.9% of Asian people.
Percentage of Demographic at or Below the Poverty Line
In the US, a Black Person Is 36.8% Less Likely to Own a Home Than a White Person
Homeownership is a large milestone in many adults’ lives, as owning property has long been seen as a key factor in growing an individual’s wealth and ensuring financial stability. It also provides a way for families to accumulate generational wealth. However, homeownership in the new generation is declining: 61.1% of adults aged 35-44 owned homes in 2022, compared with 68.3% 20 years prior. In the US, 73.2% of white people own homes, while only 46.3% of Black people own homes.
Percentage of White Homeowners in the U.S.
Percentage of Black Homeowners in the U.S.
In the 2022 Survey of Consumer Finances, the median home value of non-Hispanic white households was $330,000. The median home value of Black households was $250,000, and the median Hispanic-owned home was $275,000.
Median Home Values in the U.S.
Saving by Black Families Lags
Saving for retirement throughout your lifetime is crucial to ensure future financial health. With daily costs increasing, sufficient financial preparation for retirement is becoming increasingly difficult for a large portion of the population. In the 2022 Survey of Consumer Finances, only 54% of families in America held a retirement account.
Percentage of Retirement Accounts in the U.S.
Looking deeper, 61.8% of non-Hispanic white families held retirement accounts, while only 27.5% of Hispanic and 34.8% of Black families held retirement accounts in 2022.
Percentage of Retirement Accounts Open in 2022
It’s also important to evaluate how much these groups have saved for retirement. While the specifics vary based on lifestyle and spending habits, Fidelity’s Age-Based Savings Benchmarks recommend that retirees over 60 have 8 times their salary in savings. Below, we show how each demographic’s median retirement account balance compares with this benchmark.
Median Balance in Retirement Accounts of Households in 2022
Student Loan Debt More Than Twice as High for Black Grads
The ability to save for retirement might be outweighed by the need to pay off debt, and student loans are one of the biggest sources of debt for Americans. Pew research reports that one in four US adults under 40 have student loan debt. The Survey of Consumer Finances shows that of all college-educated adults, 35.9% of Black graduates were paying off student loans in 2022, compared with only 19.8% of their white peers.
Percentage of Graduates with Student Loan Debt
Through visual representations of the data, we see striking differences in how wealth is distributed across racial and ethnic groups in the US.
The author or authors do not own shares in any securities mentioned in this article. Find out about Morningstar’s editorial policies.

 United States